

Chotosan ameliorates cognitive and emotional deficits in an animal model of type 2 diabetes: possible involvement of cholinergic and VEGF/PDGF mechanisms in the brain
- PMID: 23082896
- PMCID: PMC3564934
- DOI: 10.1186/1472-6882-12-188
Chotosan ameliorates cognitive and emotional deficits in an animal model of type 2 diabetes: possible involvement of cholinergic and VEGF/PDGF mechanisms in the brain
Abstract
Background: Diabetes is one of the risk factors for cognitive deficits such as Alzheimer's disease. To obtain a better understanding of the anti-dementia effect of chotosan (CTS), a Kampo formula, we investigated its effects on cognitive and emotional deficits of type 2 diabetic db/db mice and putative mechanism(s) underlying the effects.
Methods: Seven-week-old db/db mice received daily administration of CTS (375 - 750 mg/kg, p.o.) and the reference drug tacrine (THA: 2.5 mg/kg, i.p.) during an experimental period of 7 weeks. From the age of 9-week-old, the animals underwent the novel object recognition test, the modified Y-maze test, and the water maze test to elucidate cognitive performance and the elevated plus maze test to elucidate anxiety-related behavior. After completing behavioral studies, Western blotting and immunohistochemical studies were conducted.
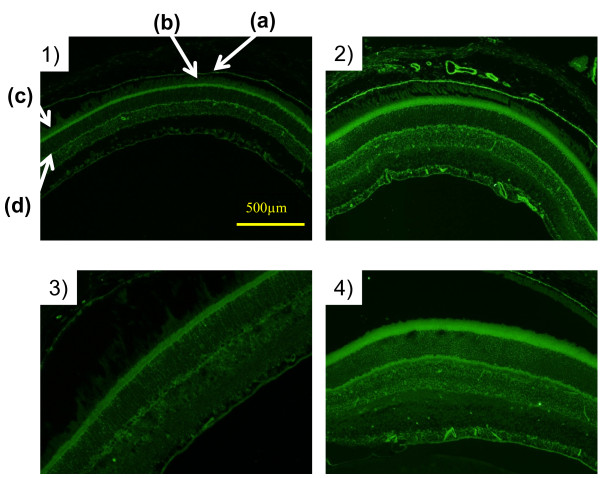
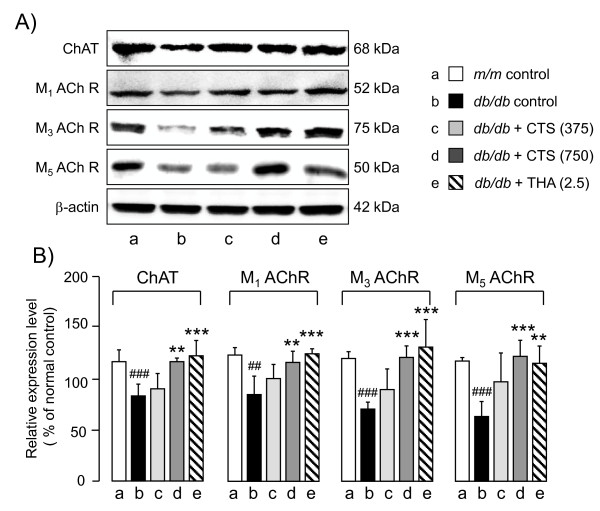
Results: Compared with age-matched non-diabetic control strain (m/m) mice, db/db mice exhibited impaired cognitive performance and an increased level of anxiety. CTS ameliorated cognitive and emotional deficits of db/db mice, whereas THA improved only cognitive performance. The phosphorylated levels of Akt and PKCα in the hippocampus were significantly lower and higher, respectively, in db/db mice than in m/m mice. Expression levels of the hippocampal cholinergic marker proteins and the number of the septal cholinergic neurons were also reduced in db/db mice compared with those in m/m mice. Moreover, the db/db mice had significantly reduced levels of vasculogenesis/angiogenesis factors, vascular endothelial growth factor (VEGF), VEGF receptor type 2, platelet-derived growth factor-B, and PDGF receptor β, in the hippocampus. CTS and THA treatment reversed these neurochemical and histological alterations caused by diabetes.
Conclusion: These results suggest that CTS ameliorates diabetes-induced cognitive deficits by protecting central cholinergic and VEGF/PDGF systems via Akt signaling pathway and that CTS exhibits the anxiolytic effect via neuronal mechanism(s) independent of cholinergic or VEGF/PDGF systems in db/db mice.
Figures


Similar articles
-
Diabetes-induced central cholinergic neuronal loss and cognitive deficit are attenuated by tacrine and a Chinese herbal prescription, kangen-karyu: elucidation in type 2 diabetes db/db mice.J Pharmacol Sci. 2011;117(4):230-42. doi: 10.1254/jphs.11115fp. Epub 2011 Nov 12. J Pharmacol Sci. 2011. PMID: 22083044
-
Chotosan (Diaoteng San)-induced improvement of cognitive deficits in senescence-accelerated mouse (SAMP8) involves the amelioration of angiogenic/neurotrophic factors and neuroplasticity systems in the brain.Chin Med. 2011 Sep 23;6:33. doi: 10.1186/1749-8546-6-33. Chin Med. 2011. PMID: 21943225 Free PMC article.
-
Chemical profiling with HPLC-FTMS of exogenous and endogenous chemicals susceptible to the administration of chotosan in an animal model of type 2 diabetes-induced dementia.J Pharm Biomed Anal. 2015 Feb;104:21-30. doi: 10.1016/j.jpba.2014.11.019. Epub 2014 Nov 18. J Pharm Biomed Anal. 2015. PMID: 25459756
-
Chotosan, a kampo formula, ameliorates chronic cerebral hypoperfusion-induced deficits in object recognition behaviors and central cholinergic systems in mice.J Pharmacol Sci. 2007 Apr;103(4):360-73. doi: 10.1254/jphs.fp0061457. Epub 2007 Mar 31. J Pharmacol Sci. 2007. PMID: 17409635
-
Kampo formulations, chotosan, and yokukansan, for dementia therapy: existing clinical and preclinical evidence.J Pharmacol Sci. 2013;122(4):257-69. doi: 10.1254/jphs.13r03cr. Epub 2013 Jul 25. J Pharmacol Sci. 2013. PMID: 23883485 Review.
Cited by
-
Sansoninto, a traditional herbal medicine, ameliorates behavioral abnormalities and down-regulation of early growth response-1 expression in mice exposed to social isolation stress.J Tradit Complement Med. 2017 Apr 12;8(1):81-88. doi: 10.1016/j.jtcme.2017.03.004. eCollection 2018 Jan. J Tradit Complement Med. 2017. PMID: 29321993 Free PMC article.
-
The Role of Oxidized Cholesterol in Diabetes-Induced Lysosomal Dysfunction in the Brain.Mol Neurobiol. 2016 May;53(4):2287-96. doi: 10.1007/s12035-015-9207-1. Epub 2015 May 15. Mol Neurobiol. 2016. PMID: 25976368 Free PMC article.
-
Bacopa monnieri ameliorates memory deficits in olfactory bulbectomized mice: possible involvement of glutamatergic and cholinergic systems.Neurochem Res. 2013 Oct;38(10):2201-15. doi: 10.1007/s11064-013-1129-6. Epub 2013 Aug 15. Neurochem Res. 2013. PMID: 23949198
-
Peripheral versus central insulin and leptin resistance: Role in metabolic disorders, cognition, and neuropsychiatric diseases.Neuropharmacology. 2022 Feb 1;203:108877. doi: 10.1016/j.neuropharm.2021.108877. Epub 2021 Nov 8. Neuropharmacology. 2022. PMID: 34762922 Free PMC article. Review.
-
Three-dimensional-arterial spin labeling perfusion correlation with diabetes-associated cognitive dysfunction and vascular endothelial growth factor in type 2 diabetes mellitus rat.World J Diabetes. 2021 Apr 15;12(4):499-513. doi: 10.4239/wjd.v12.i4.499. World J Diabetes. 2021. PMID: 33889293 Free PMC article.
References
-
- de la Torre JC. Pathophysiology of neuronal energy crisis in Alzheimer’s disease. Neurodegener Dis. 2008;5(3–4):126–132. - PubMed
-
- Zhao Q, Matsumoto K, Tsuneyama K, Tanaka K, Li F, Shibahara N, Miyata T, Yokozawa T. Diabetes-induced central cholinergic neuronal loss and cognitive deficit are attenuated by tacrine and a Chinese herbal prescription, kangen-karyu: elucidation in type 2 diabetes db/db mice. J Pharmacol Sci. 2011;117:230–242. doi: 10.1254/jphs.11115FP. - DOI - PubMed
Publication types
MeSH terms
Substances
LinkOut - more resources
Full Text Sources
Medical
Research Materials
Miscellaneous
