. 2013 Jan;19(1):20-9.
doi: 10.1111/cns.12013. Epub 2012 Oct 20.

Exogenous basic fibroblast growth factor inhibits ER stress-induced apoptosis and improves recovery from spinal cord injury

Affiliations

Exogenous basic fibroblast growth factor inhibits ER stress-induced apoptosis and improves recovery from spinal cord injury

Hong-Yu Zhang et al. CNS Neurosci Ther. 2013 Jan.

Abstract

Aim: To investigate the mechanism of endoplasmic reticulum (ER) stress-induced apoptosis as well as the protective action of basic fibroblast growth factor (bFGF) both in vivo and in vitro.

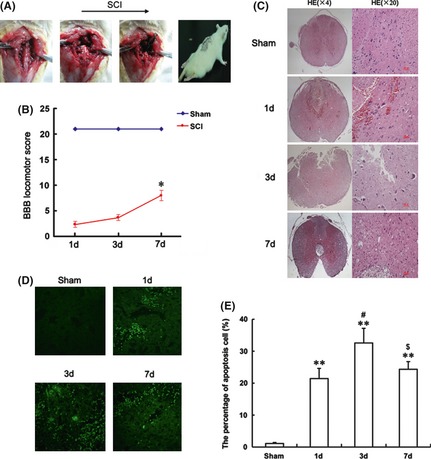
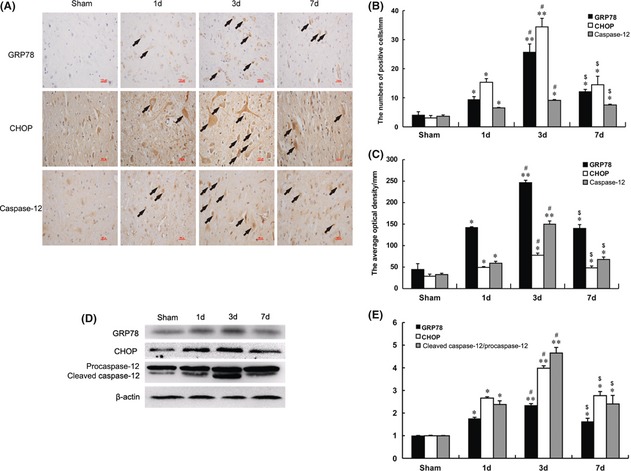
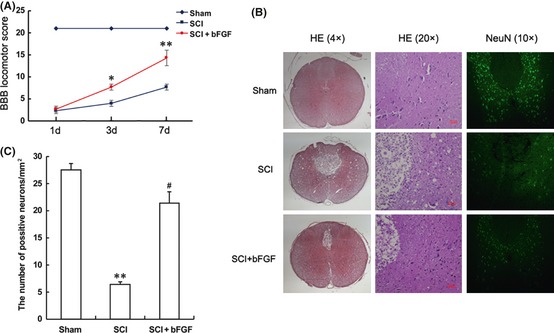
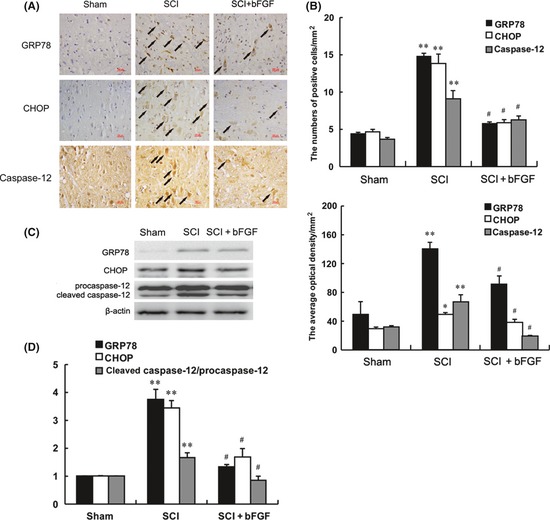
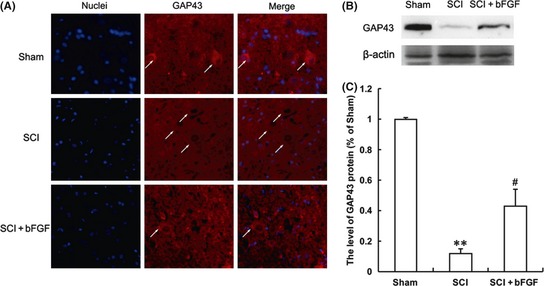
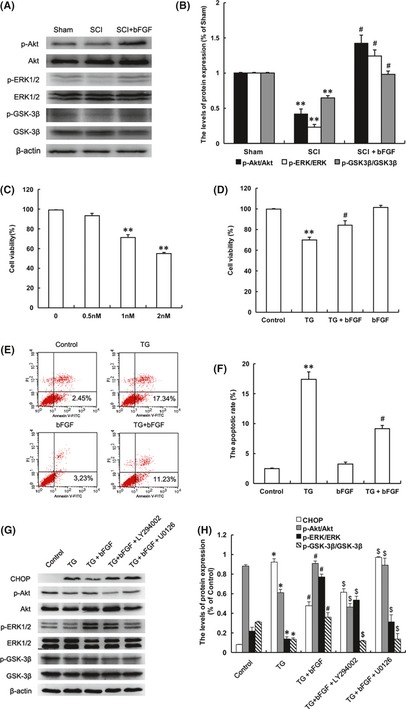
Methods and results: ER stress-induced apoptosis was involved in the injuries of spinal cord injury (SCI) model rat. bFGF administration improved the recovery and increased the survival of neurons in spinal cord lesions in model rat. The protective effect of bFGF is related to the inhibition of CHOP, GRP78 and caspase-12, which are ER stress-induced apoptosis response proteins. bFGF administration also increased the survival of neurons and the expression of growth-associated protein 43 (GAP43), which is related to neural regeneration. The protective effect of bFGF is related to the activation of downstream signals, PI3K/Akt/GSK-3β and ERK1/2, especially in the ER stress cell model.

Conclusions: This is the first study to illustrate that the role of bFGF in SCI recovery is related to the inhibition of ER stress-induced cell death via the activation of downstream signals. Our work also suggested a new trend for bFGF drug development in central neural system injuries, which are involved in chronic ER stress-induced apoptosis.


Conflict of interest statement

The authors declare no conflict of interest.

Figures

Figure 1
Figure 1
The procedure and assessment of spinal cord injury (SCI) model rat. (A) The procedure of the SCI model from left to right, as shown by arrow head. (B) The Basso, Beattie and Bresnahan (BBB) scores of SCI model rat at 1, 3 and 7 days after contusion. The score of the sham group was 21 points (meaning normal locomotion). *represents P < 0.05 versus the sham group. Data are the mean values ± SEM, n = 6. One‐way ANOVA with Dunnett's post hoc test was performed for statistical evaluation. (C) H and E staining results of SCI rat at 1, 3 and 7 days after contusion. (D) TUNEL apoptosis assay of model rat spinal cord lesions. Immunofluorescence results of the TUNEL assay. Bright green dots were deemed positive apoptosis cell, magnification was 20×. (E) The analysis of apoptosis cell 1, 3 and 7 days after spinal cord injury lesions. The percentage of apoptosis was counted from 3 random 1 × 1 mm2 areas. **represents P < 0.01 versus the sham group, #represents P < 0.05 versus the 1 day group, and $represents P < 0.05 versus the 3 days group. Data are the mean values ± SEM, n = 6.
Figure 2
Figure 2
ER stress–induced apoptosis was involved in the early stage of spinal cord injury (SCI). (A) Immunohistochemistry for GRP78, CHOP and caspase‐12 in sham, 1, 3 and 7 days after spinal cord injury lesions groups (B) Analysis of the positive cells and optical density (C) of the immunohistochemistry results. *represents P < 0.05 versus the sham group, **represents P < 0.01 versus the sham group, #represents P < 0.05 versus the 1 day group, and $represents P < 0.05 versus the 3 days group. Data are the mean values ± SEM, n = 6. (D) Protein expressions of GRP78, CHOP and caspase‐12 in the spinal cord segment at the contusion epicenter. β‐actin was used as the loading control and for band density normalization. (E) The optical density analyses of GRP78, CHOP, and caspase‐12 protein. *represents P < 0.05 versus the sham group, **represents P < 0.01 versus the sham group, #represents P < 0.05 versus the 1 day group, and $represents P < 0.05 versus the 3 days group. Data are the mean values ± SEM, n = 6.
Figure 3
Figure 3
Basic fibroblast growth factor (bFGF) improves the recovery of spinal cord injury (SCI) rat and the survival of neurons. (A) The Basso, Beattie and Bresnahan (BBB) scores of sham, SCI group and SCI rat treated with bFGF group. *represents P < 0.05 versus the SCI group, and **represents P < 0.01 versus the SCI group, n = 6. (B) H and E staining and NeuN staining results of the sham, SCI group and SCI rat treated with bFGF group. The bright green dots in the right column are positive staining neurons. (C) Analysis of the positive neurons of the NeuN staining results. **represents P < 0.01 versus the sham group, and #represents P < 0.01 versus the SCI group, n = 6.
Figure 4
Figure 4
Basic fibroblast growth factor (bFGF) administration inhibits the expressions of ER stress–induced apoptosis response proteins, GRP78, CHOP and caspase‐12. Immunohistochemistry for GRP78, CHOP and caspase‐12 in the sham, 7 days after spinal cord injury lesion and bFGF treatment 7 days after injury groups (A) Analysis of the positive cells and optical density (B) of the immunohistochemistry results. *Represents P < 0.05 versus the sham group, **represents P < 0.01 versus the sham group, #represents P < 0.05 versus the spinal cord injury (SCI) group, Data are the mean values ± SEM, n = 6. (C) Protein expressions of GRP78, CHOP and caspase‐12 for the sham, SCI and bFGF treatment groups. β‐actin was used as the loading control and for band density normalization. (D) The optical density analysis of GRP78, CHOP, and caspase‐12 protein. **represents P < 0.01 versus the sham group, #represents P < 0.05 versus the 1 day group. Data are the mean values ± SEM, n = 6.
Figure 5
Figure 5
Basic fibroblast growth factor (bFGF) administration increases the level of GAP43 in spinal cord lesions. (A) Immunofluorescence staining results of GAP43; the nuclear is labeled by Hoechst (blue), the neurons with obvious GAP43 signals are labeled with white arrow heads, magnification was 20×. (B) The protein expressions of GAP43 in the sham, spinal cord injury (SCI) rat and SCI rat treated with bFGF groups. (C) The optical density analysis of GAP43 protein. **represents P < 0.01 versus the sham group, and #represents P < 0.05 versus the SCI group. Data are the mean values ± SEM, n = 6.
Figure 6
Figure 6
PI3K/Akt/GSK‐3β and ERK1/2 signal pathways are involved in the protective effect of basic fibroblast growth factor (bFGF) both in the spinal cord of spinal cord injury (SCI) rat and PC12 cells under stress. (A) The protein expressions of p‐Akt/Akt, p‐ERK/ERK, p‐GSK‐3β/GSK‐3β in the sham, SCI model and SCI rat treated with bFGF groups. (B) The optical density analysis of p‐Akt/Akt, p‐ERK/ERK, p‐GSK‐3β/GSK‐3β protein. **represents P < 0.01 versus the sham group, and #represents P < 0.05 versus the SCI group. Data are the mean values ± SEM, n = 6. (C) MTT results of the different concentrations of thapsigargin (TG)‐treated PC12 cells. (D) MTT result of bFGF‐treated PC12 cells induced by TG. (E) FACScan result of PI/Annexin V‐FITC staining for cell apoptosis analysis. (F) Statistical result of apoptosis rate in PC12 cells treated with TG and bFGF. **represents P < 0.01 versus the control group, and #represents P < 0.05 versus the TG group. Data are the mean values ± SEM, n = 3. (G) The protein expressions of CHOP, GRP78, p‐Akt, p‐ERK1/2, p‐GSK‐3β in ER stress–induced apoptosis PC12 cells treated with bFGF and different inhibitors. β‐actin was used as the loading control and for band density normalization. (H) The optical density analysis of CHOP, GRP78, p‐Akt, p‐ERK1/2 and p‐GSK‐3β protein. *represents P < 0.05 versus the control group, #represents P < 0.01 versus the TG group, $represents P < 0.05 versus the TG+bFGF group. Data are the mean values ± SEM, n = 3.

Similar articles

Cited by

References

    1. Penas C, Guzman MS, Verdu E, et al. Spinal cord injury induces endoplasmic reticulum stress with different cell‐type dependent response. J Neurochem 2007;102:1242–1255. - PubMed
    1. Dasari VR, Veeravalli KK, Tsung AJ, et al. Neuronal apoptosis is inhibited by cord blood stem cells after spinal cord injury. J Neurotrauma 2009;26:2057–2069. - PubMed
    1. Beattie MS. Inflammation and apoptosis: linked therapeutic targets in spinal cord injury. Trends Mol Med 2004;10:580–583. - PubMed
    1. Jing G, Wang JJ, Zhang SX. ER stress and apoptosis: a new mechanism for retinal cell death. Exp Diabetes Res 2012; 2012: 589589. - PMC - PubMed
    1. Badiola N, Penas C, Minano‐Molina A, et al. Induction of ER stress in response to oxygen‐glucose deprivation of cortical cultures involves the activation of the PERK and IRE‐1 pathways and of caspase‐12. Cell Death Dis 2011;2:e149. - PMC - PubMed

Publication types

MeSH terms