

dsPIG: a tool to predict imprinted genes from the deep sequencing of whole transcriptomes
- PMID: 23083219
- PMCID: PMC3497615
- DOI: 10.1186/1471-2105-13-271
dsPIG: a tool to predict imprinted genes from the deep sequencing of whole transcriptomes
Abstract
Background: Dysregulation of imprinted genes, which are expressed in a parent-of-origin-specific manner, plays an important role in various human diseases, such as cancer and behavioral disorder. To date, however, fewer than 100 imprinted genes have been identified in the human genome. The recent availability of high-throughput technology makes it possible to have large-scale prediction of imprinted genes. Here we propose a Bayesian model (dsPIG) to predict imprinted genes on the basis of allelic expression observed in mRNA-Seq data of independent human tissues.
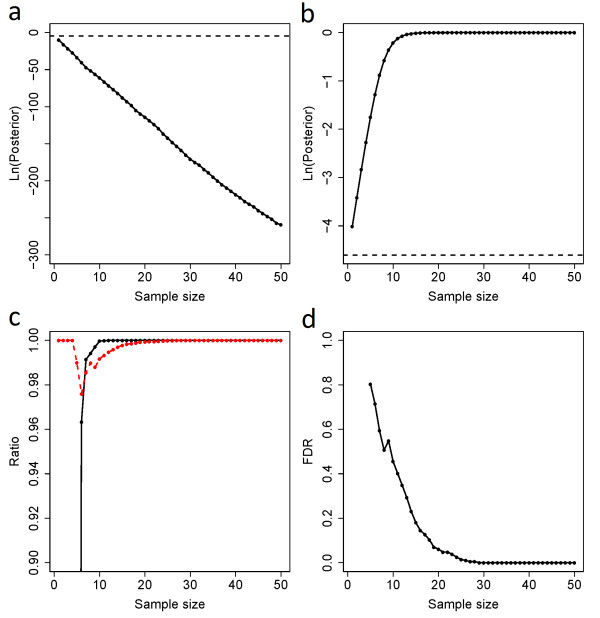
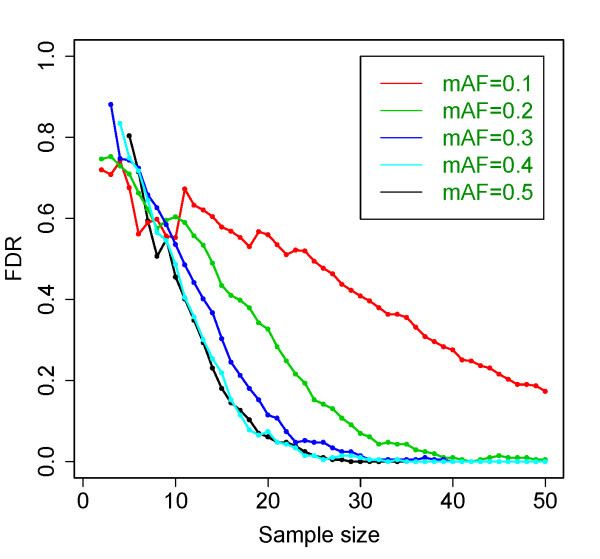
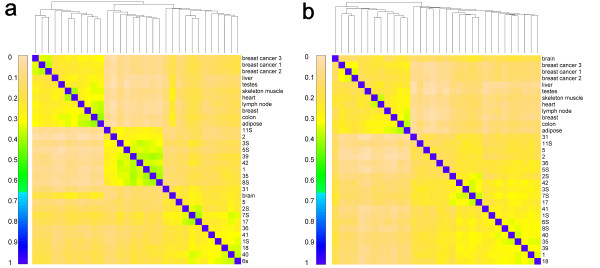
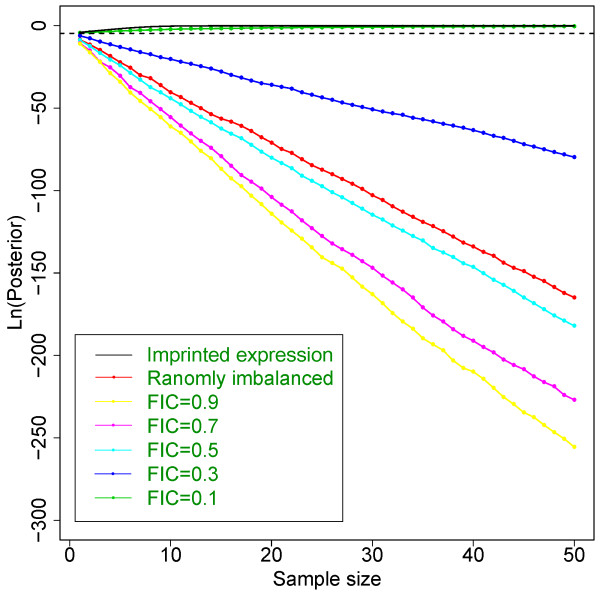
Results: Our model (dsPIG) was capable of identifying imprinted genes with high sensitivity and specificity and a low false discovery rate when the number of sequenced tissue samples was fairly large, according to simulations. By applying dsPIG to the mRNA-Seq data, we predicted 94 imprinted genes in 20 cerebellum samples and 57 imprinted genes in 9 diverse tissue samples with expected low false discovery rates. We also assessed dsPIG using previously validated imprinted and non-imprinted genes. With simulations, we further analyzed how imbalanced allelic expression of non-imprinted genes or different minor allele frequencies affected the predictions of dsPIG. Interestingly, we found that, among biallelically expressed genes, at least 18 genes expressed significantly more transcripts from one allele than the other among different individuals and tissues.
Conclusion: With the prevalence of the mRNA-Seq technology, dsPIG has become a useful tool for analysis of allelic expression and large-scale prediction of imprinted genes. For ease of use, we have set up a web service and also provided an R package for dsPIG at http://www.shoudanliang.com/dsPIG/.
Figures
Similar articles
-
Global survey of genomic imprinting by transcriptome sequencing.Curr Biol. 2008 Nov 25;18(22):1735-41. doi: 10.1016/j.cub.2008.09.044. Curr Biol. 2008. PMID: 19026546
-
Computation method to identify differential allelic gene expression and novel imprinted genes.Bioinformatics. 2003 May 22;19(8):952-5. doi: 10.1093/bioinformatics/btg127. Bioinformatics. 2003. PMID: 12761057
-
Using RNA sequencing for identifying gene imprinting and random monoallelic expression in human placenta.Epigenetics. 2014 Oct;9(10):1397-409. doi: 10.4161/15592294.2014.970052. Epigenetics. 2014. PMID: 25437054 Free PMC article.
-
Using next-generation RNA sequencing to identify imprinted genes.Heredity (Edinb). 2014 Aug;113(2):156-66. doi: 10.1038/hdy.2014.18. Epub 2014 Mar 12. Heredity (Edinb). 2014. PMID: 24619182 Free PMC article. Review.
-
Imprinted genes and human disease: an evolutionary perspective.Adv Exp Med Biol. 2008;626:101-15. Adv Exp Med Biol. 2008. PMID: 18372794 Review.
Cited by
-
The Impact of High-mobility Group Box Mutation of T-cell Factor 4 on Its Genomic Binding Pattern in Non-small Cell Lung Cancer.Transl Oncol. 2020 Jan;13(1):79-85. doi: 10.1016/j.tranon.2019.09.012. Epub 2019 Dec 2. Transl Oncol. 2020. PMID: 31805518 Free PMC article.
-
Replicate sequencing libraries are important for quantification of allelic imbalance.Nat Commun. 2021 Jun 7;12(1):3370. doi: 10.1038/s41467-021-23544-8. Nat Commun. 2021. PMID: 34099647 Free PMC article.
-
Selective translational usage of TSS and core promoters revealed by translatome sequencing.BMC Genomics. 2019 Apr 11;20(1):282. doi: 10.1186/s12864-019-5650-0. BMC Genomics. 2019. PMID: 30987607 Free PMC article.
-
Allelic expression patterns of imprinted and non-imprinted genes in cancer cell lines from multiple histologies.Clin Epigenetics. 2025 May 25;17(1):83. doi: 10.1186/s13148-025-01883-3. Clin Epigenetics. 2025. PMID: 40414875 Free PMC article.
-
Tools and best practices for data processing in allelic expression analysis.Genome Biol. 2015 Sep 17;16(1):195. doi: 10.1186/s13059-015-0762-6. Genome Biol. 2015. PMID: 26381377 Free PMC article.
References
-
- Lyon MF. X chromosomes and dosage compensation. Nature. 1986;320:313. - PubMed
Publication types
MeSH terms
Substances
Grants and funding
LinkOut - more resources
Full Text Sources
