The spatial epidemiology of tuberculosis in Linyi City, China, 2005-2010
- PMID: 23083352
- PMCID: PMC3487863
- DOI: 10.1186/1471-2458-12-885
The spatial epidemiology of tuberculosis in Linyi City, China, 2005-2010
Abstract
Background: Tuberculosis (TB) remains a major public health burden in many developing countries. China alone accounted for an estimated 12% of all incident TB cases worldwide in 2010. Several studies showed that the spatial distribution of TB was nonrandom and clustered. Thus, a spatial analysis was conducted with the aim to explore the spatial epidemiology of TB in Linyi City, which can provide guidance for formulating regional prevention and control strategies.
Methods: The study was based on the reported cases of TB, between 2005 and 2010. 35,308 TB cases were geo-coded at the town level (n = 180). The spatial empirical Bayes smoothing, spatial autocorrelation and space-time scan statistic were used in this analysis.
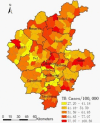
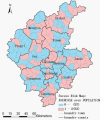
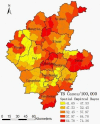
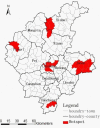
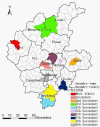
Results: Spatial distribution of TB in Linyi City from 2005 to 2010 was mapped at town level in the aspects of crude incidence, excess hazard and spatial smoothed incidence. The spatial distribution of TB was nonrandom and clustered with the significant Moran's I for each year. Local G(i)* detected five significant spatial clusters for high incidence of TB. The space-time analysis identified one most likely cluster and nine secondary clusters for high incidence of TB.
Conclusions: There is evidence for the existence of statistically significant TB clusters in Linyi City, China. The result of this study may assist health departments to develop a better preventive strategy and increase the public health intervention's effectiveness.
Figures

References
-
- World Health Organization. Global Tuberculosis Control. 2011. http://www.who.int/tb/publications/global_report/2011/gtbr11_full.pdf.
Publication types
MeSH terms
LinkOut - more resources
Full Text Sources

