

STICCS reveals matrix-dependent adhesion slipping and gripping in migrating cells
- PMID: 23083710
- PMCID: PMC3475391
- DOI: 10.1016/j.bpj.2012.08.060
STICCS reveals matrix-dependent adhesion slipping and gripping in migrating cells
Abstract
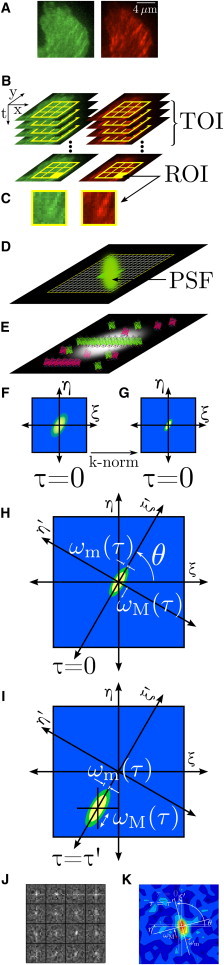
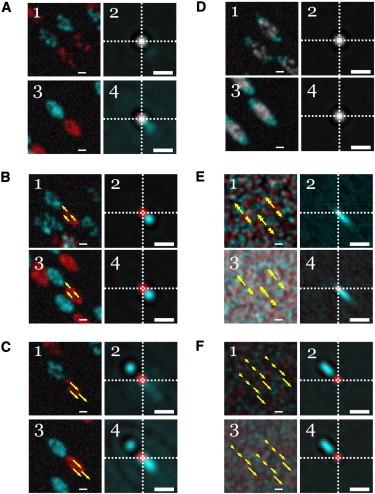
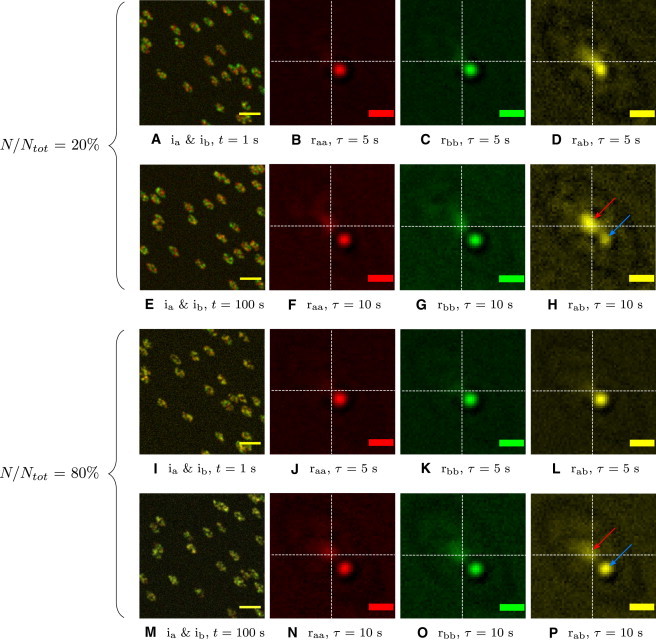
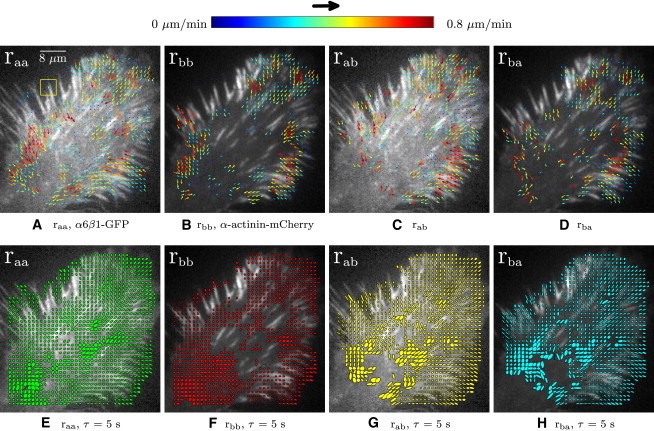
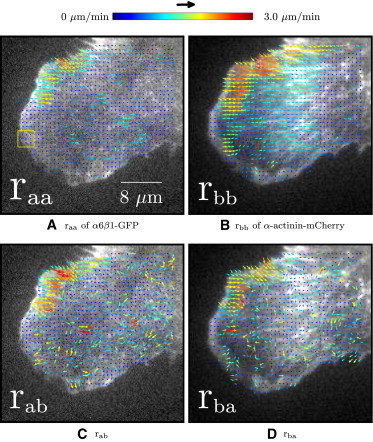
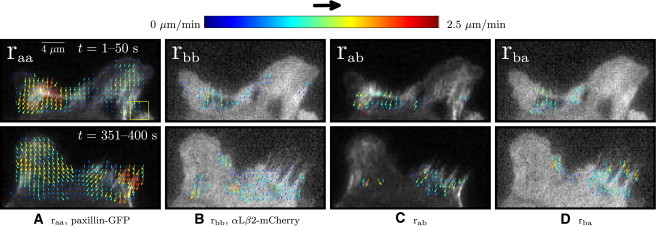
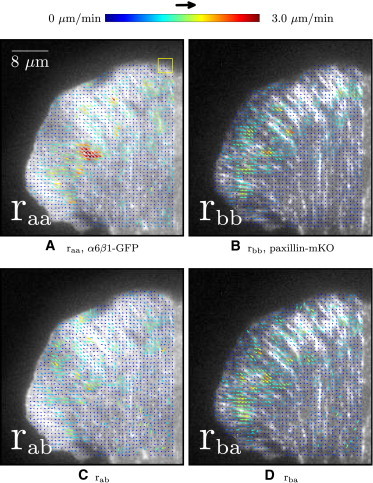
Two-color spatio-temporal image cross-correlation spectroscopy (STICCS) is a new, to our knowledge, image analysis method that calculates space-time autocorrelation and cross-correlation functions from fluorescence intensity fluctuations. STICCS generates cellular flow and diffusion maps that reveal interactions and cotransport of two distinct molecular species labeled with different fluorophores. Here we use computer simulations to map the capabilities and limitations of STICCS for measurements in complex heterogeneous environments containing micro- and macrostructures. We then use STICCS to analyze the co-flux of adhesion components in migrating cells imaged using total internal reflection fluorescence microscopy. The data reveal a robust, time-dependent co-fluxing of certain integrins and paxillin in adhesions in protrusions when they pause, and in adhesions that are sliding and disassembling, demonstrating that the molecules in these adhesions move as a complex. In these regions, both α6β1- or αLβ2-integrins, expressed in CHO.B2 cells, co-flux with paxillin; an analogous cotransport was seen for α6β1-integrin and α-actinin in U2OS. This contrasts with the behavior of the α5β1-integrin and paxillin, which do not co-flux. Our results clearly show that integrins can move in complexes with adhesion proteins in protrusions that are retracting.
Copyright © 2012 Biophysical Society. Published by Elsevier Inc. All rights reserved.
Figures
Similar articles
-
The integrin-ligand interaction regulates adhesion and migration through a molecular clutch.PLoS One. 2012;7(7):e40202. doi: 10.1371/journal.pone.0040202. Epub 2012 Jul 6. PLoS One. 2012. PMID: 22792239 Free PMC article.
-
Differential dynamics of alpha 5 integrin, paxillin, and alpha-actinin during formation and disassembly of adhesions in migrating cells.J Cell Biol. 2001 Jun 25;153(7):1427-40. doi: 10.1083/jcb.153.7.1427. J Cell Biol. 2001. PMID: 11425873 Free PMC article.
-
Spatial mapping of integrin interactions and dynamics during cell migration by image correlation microscopy.J Cell Sci. 2004 Nov 1;117(Pt 23):5521-34. doi: 10.1242/jcs.01416. Epub 2004 Oct 12. J Cell Sci. 2004. PMID: 15479718
-
Advances in image correlation spectroscopy: measuring number densities, aggregation states, and dynamics of fluorescently labeled macromolecules in cells.Cell Biochem Biophys. 2007;49(3):141-64. doi: 10.1007/s12013-007-9000-5. Epub 2007 Oct 2. Cell Biochem Biophys. 2007. PMID: 17952641 Review.
-
Spatio-temporal image correlation spectroscopy and super-resolution microscopy to quantify molecular dynamics in T cells.Methods. 2018 May 1;140-141:112-118. doi: 10.1016/j.ymeth.2018.01.017. Epub 2018 Feb 2. Methods. 2018. PMID: 29410223 Review.
Cited by
-
Quantifying intracellular dynamics using fluorescence fluctuation spectroscopy.Protoplasma. 2014 Mar;251(2):307-16. doi: 10.1007/s00709-013-0602-z. Epub 2014 Jan 14. Protoplasma. 2014. PMID: 24420265 Review.
-
Intracellular kinetics of the androgen receptor shown by multimodal Image Correlation Spectroscopy (mICS).Sci Rep. 2016 Mar 3;6:22435. doi: 10.1038/srep22435. Sci Rep. 2016. PMID: 26936218 Free PMC article.
-
Dynamics of adhesion molecule domains on neutrophil membranes: surfing the dynamic cell topography.Eur Biophys J. 2013 Dec;42(11-12):851-5. doi: 10.1007/s00249-013-0931-z. Epub 2013 Oct 10. Eur Biophys J. 2013. PMID: 24113789 Free PMC article.
-
Far-red organic fluorophores contain a fluorescent impurity.Chemphyschem. 2014 Aug 4;15(11):2240-6. doi: 10.1002/cphc.201402002. Epub 2014 Apr 29. Chemphyschem. 2014. PMID: 24782148 Free PMC article.
-
Fluctuation imaging spiced up with a piece of PIE.Biophys J. 2013 Aug 20;105(4):831. doi: 10.1016/j.bpj.2013.05.062. Biophys J. 2013. PMID: 23972830 Free PMC article. No abstract available.
References
-
- Chen Y., Müller J.D., Gratton E. Fluorescence fluctuation spectroscopy. Methods. 1999;19:234–252. - PubMed
-
- Magde D., Elson E., Webb W. Thermodynamic fluctuations in a reacting system—measurement by fluorescence correlation spectroscopy. Phys. Rev. Lett. 1972;29:705–708.
-
- Elson E., Magde D. Fluorescence correlation spectroscopy. I. Conceptual basis and theory. Biopolymers. 1974;13:1–27. - PubMed
-
- Magde D., Elson E.L., Webb W.W. Fluorescence correlation spectroscopy. II. An experimental realization. Biopolymers. 1974;13:29–61. - PubMed
Publication types
MeSH terms
Substances
Grants and funding
LinkOut - more resources
Full Text Sources
Molecular Biology Databases
