

Video-rate confocal microscopy for single-molecule imaging in live cells and superresolution fluorescence imaging
- PMID: 23083712
- PMCID: PMC3475383
- DOI: 10.1016/j.bpj.2012.09.014
Video-rate confocal microscopy for single-molecule imaging in live cells and superresolution fluorescence imaging
Abstract
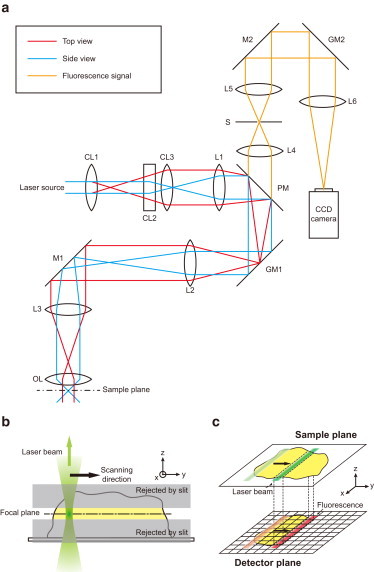
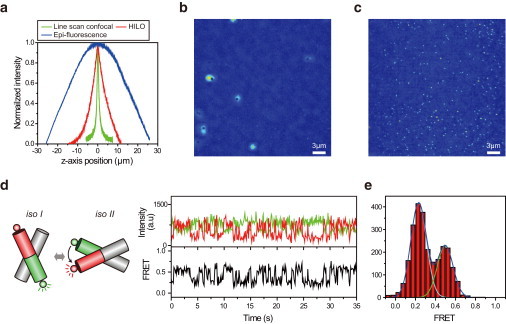
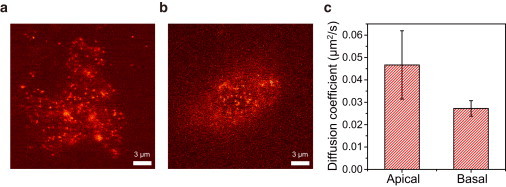
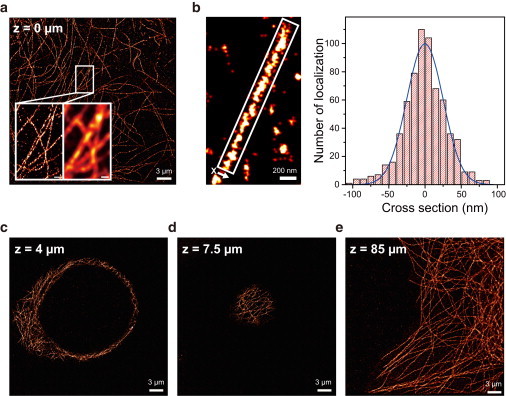
There is no confocal microscope optimized for single-molecule imaging in live cells and superresolution fluorescence imaging. By combining the swiftness of the line-scanning method and the high sensitivity of wide-field detection, we have developed a, to our knowledge, novel confocal fluorescence microscope with a good optical-sectioning capability (1.0 μm), fast frame rates (<33 fps), and superior fluorescence detection efficiency. Full compatibility of the microscope with conventional cell-imaging techniques allowed us to do single-molecule imaging with a great ease at arbitrary depths of live cells. With the new microscope, we monitored diffusion motion of fluorescently labeled cAMP receptors of Dictyostelium discoideum at both the basal and apical surfaces and obtained superresolution fluorescence images of microtubules of COS-7 cells at depths in the range 0-85 μm from the surface of a coverglass.
Copyright © 2012 Biophysical Society. Published by Elsevier Inc. All rights reserved.
Figures
Similar articles
-
Robust scan synchronized force-fluorescence imaging.Ultramicroscopy. 2021 Feb;221:113165. doi: 10.1016/j.ultramic.2020.113165. Epub 2020 Nov 15. Ultramicroscopy. 2021. PMID: 33352414 Free PMC article.
-
Three-Color Simultaneous Live Imaging of Autophagy-Related Structures.Methods Mol Biol. 2019;1880:223-230. doi: 10.1007/978-1-4939-8873-0_14. Methods Mol Biol. 2019. PMID: 30610700
-
Single-molecule fluorescence imaging in living cells.Annu Rev Phys Chem. 2013;64:459-80. doi: 10.1146/annurev-physchem-040412-110127. Epub 2013 Jan 16. Annu Rev Phys Chem. 2013. PMID: 23331306 Review.
-
Superresolution fluorescence microscopy for 3D reconstruction of thick samples.Mol Brain. 2018 Mar 15;11(1):17. doi: 10.1186/s13041-018-0361-z. Mol Brain. 2018. PMID: 29544505 Free PMC article.
-
Live cell spinning disk microscopy.Adv Biochem Eng Biotechnol. 2005;95:57-75. doi: 10.1007/b102210. Adv Biochem Eng Biotechnol. 2005. PMID: 16080265 Review.
Cited by
-
Three-Dimensional Single-Molecule Localization Microscopy in Whole-Cell and Tissue Specimens.Annu Rev Biomed Eng. 2020 Jun 4;22:155-184. doi: 10.1146/annurev-bioeng-060418-052203. Epub 2020 Apr 3. Annu Rev Biomed Eng. 2020. PMID: 32243765 Free PMC article. Review.
-
Single-molecule fluorescence microscopy review: shedding new light on old problems.Biosci Rep. 2017 Jul 21;37(4):BSR20170031. doi: 10.1042/BSR20170031. Print 2017 Aug 31. Biosci Rep. 2017. PMID: 28694303 Free PMC article. Review.
-
Super-resolution localization microscopy with photoactivatable fluorescent marker proteins.Protoplasma. 2014 Mar;251(2):349-62. doi: 10.1007/s00709-013-0566-z. Epub 2013 Oct 27. Protoplasma. 2014. PMID: 24162869 Review.
-
Precisely and accurately localizing single emitters in fluorescence microscopy.Nat Methods. 2014 Mar;11(3):253-66. doi: 10.1038/nmeth.2843. Nat Methods. 2014. PMID: 24577276 Review.
-
Imaging through the Whole Brain of Drosophila at λ/20 Super-resolution.iScience. 2019 Apr 26;14:164-170. doi: 10.1016/j.isci.2019.03.025. Epub 2019 Mar 28. iScience. 2019. PMID: 30978667 Free PMC article.
References
-
- Heilemann M., van de Linde S., Sauer M. Subdiffraction-resolution fluorescence imaging with conventional fluorescent probes. Angew. Chem. Int. Ed. Engl. 2008;47:6172–6176. - PubMed
Publication types
MeSH terms
Substances
LinkOut - more resources
Full Text Sources
Other Literature Sources
Miscellaneous
