

The effect of nonspecific binding of lambda repressor on DNA looping dynamics
- PMID: 23083719
- PMCID: PMC3475330
- DOI: 10.1016/j.bpj.2012.09.006
The effect of nonspecific binding of lambda repressor on DNA looping dynamics
Abstract
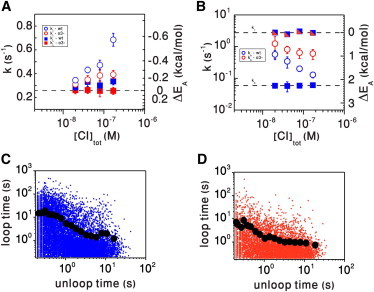
The λ repressor (CI) protein-induced DNA loop maintains stable lysogeny, yet allows efficient switching to lysis. Herein, the kinetics of loop formation and breakdown has been characterized at various concentrations of protein using tethered particle microscopy and a novel, to our knowledge, method of analysis. Our results show that a broad distribution of rate constants and complex kinetics underlie loop formation and breakdown. In addition, comparison of the kinetics of looping in wild-type DNA and DNA with mutated o3 operators showed that these sites may trigger nucleation of nonspecific binding at the closure of the loop. The average activation energy calculated from the rate constant distribution is consistent with a model in which nonspecific binding of CI between the operators shortens their effective separation, thereby lowering the energy barrier for loop formation and broadening the rate constant distribution for looping. Similarly, nonspecific binding affects the kinetics of loop breakdown by increasing the number of loop-securing protein interactions, and broadens the rate constant distribution for this reaction. Therefore, simultaneous increase of the rate constant for loop formation and reduction of that for loop breakdown stabilizes lysogeny. Given these simultaneous changes, the frequency of transitions between the looped and the unlooped state remains nearly constant. Although the loop becomes more stable thermodynamically with increasing CI concentration, it still opens periodically, conferring sensitivity to environmental changes, which may require switching to lytic conditions.
Copyright © 2012 Biophysical Society. Published by Elsevier Inc. All rights reserved.
Figures


Similar articles
-
Direct demonstration and quantification of long-range DNA looping by the lambda bacteriophage repressor.Nucleic Acids Res. 2009 May;37(9):2789-95. doi: 10.1093/nar/gkp134. Epub 2009 Mar 10. Nucleic Acids Res. 2009. PMID: 19276206 Free PMC article.
-
Transcription-factor-mediated DNA looping probed by high-resolution, single-molecule imaging in live E. coli cells.PLoS Biol. 2013;11(6):e1001591. doi: 10.1371/journal.pbio.1001591. Epub 2013 Jun 18. PLoS Biol. 2013. PMID: 23853547 Free PMC article.
-
DNA supercoiling: a regulatory signal for the λ repressor.Proc Natl Acad Sci U S A. 2014 Oct 28;111(43):15402-7. doi: 10.1073/pnas.1320644111. Epub 2014 Oct 15. Proc Natl Acad Sci U S A. 2014. PMID: 25319264 Free PMC article.
-
AFM studies of lambda repressor oligomers securing DNA loops.Curr Pharm Biotechnol. 2009 Aug;10(5):494-501. doi: 10.2174/138920109788922155. Curr Pharm Biotechnol. 2009. PMID: 19689317 Free PMC article.
-
DNA looping.Microbiol Rev. 1992 Mar;56(1):123-36. doi: 10.1128/mr.56.1.123-136.1992. Microbiol Rev. 1992. PMID: 1579106 Free PMC article. Review.
Cited by
-
Specifically bound lambda repressor dimers promote adjacent non-specific binding.PLoS One. 2018 Apr 2;13(4):e0194930. doi: 10.1371/journal.pone.0194930. eCollection 2018. PLoS One. 2018. PMID: 29608611 Free PMC article.
-
Tethered particle motion reveals that LacI·DNA loops coexist with a competitor-resistant but apparently unlooped conformation.Biophys J. 2014 Feb 4;106(3):705-15. doi: 10.1016/j.bpj.2013.12.024. Biophys J. 2014. PMID: 24507611 Free PMC article.
-
Studying DNA looping by single-molecule FRET.J Vis Exp. 2014 Jun 28;(88):e51667. doi: 10.3791/51667. J Vis Exp. 2014. PMID: 24998459 Free PMC article.
-
Nonconsensus Protein Binding to Repetitive DNA Sequence Elements Significantly Affects Eukaryotic Genomes.PLoS Comput Biol. 2015 Aug 18;11(8):e1004429. doi: 10.1371/journal.pcbi.1004429. eCollection 2015 Aug. PLoS Comput Biol. 2015. PMID: 26285121 Free PMC article.
-
Multiple LacI-mediated loops revealed by Bayesian statistics and tethered particle motion.Nucleic Acids Res. 2014;42(16):10265-77. doi: 10.1093/nar/gku563. Epub 2014 Aug 12. Nucleic Acids Res. 2014. PMID: 25120267 Free PMC article.
References
-
- Blackwood E.M., Kadonaga J.T. Going the distance: a current view of enhancer action. Science. 1998;281:60–63. - PubMed
-
- Mandal N., Su W., Echols H. DNA looping in cellular repression of transcription of the galactose operon. Genes Dev. 1990;4:410–418. - PubMed
-
- Joo C., Balci H., Ha T. Advances in single-molecule fluorescence methods for molecular biology. Annu. Rev. Biochem. 2008;77:51–76. - PubMed
Publication types
MeSH terms
Substances
Grants and funding
LinkOut - more resources
Full Text Sources
