. 2012 Oct 18;76(2):297-308.
doi: 10.1016/j.neuron.2012.07.011. Epub 2012 Oct 17.

Imaging neural activity using Thy1-GCaMP transgenic mice

Affiliations

Imaging neural activity using Thy1-GCaMP transgenic mice

Qian Chen et al. Neuron. .

Abstract

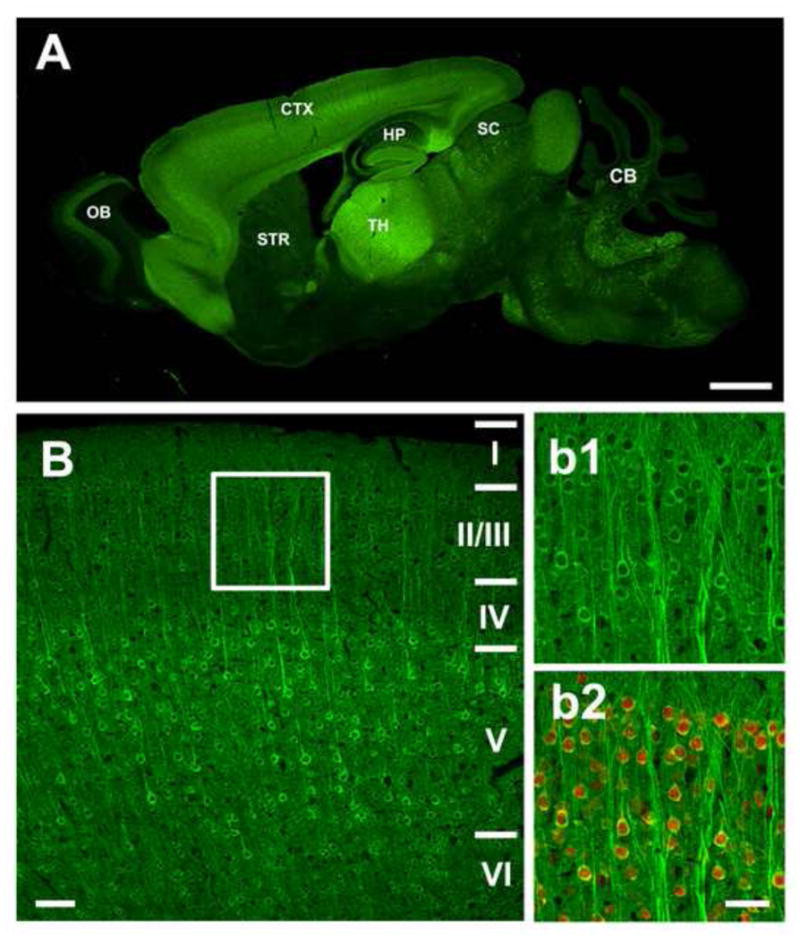
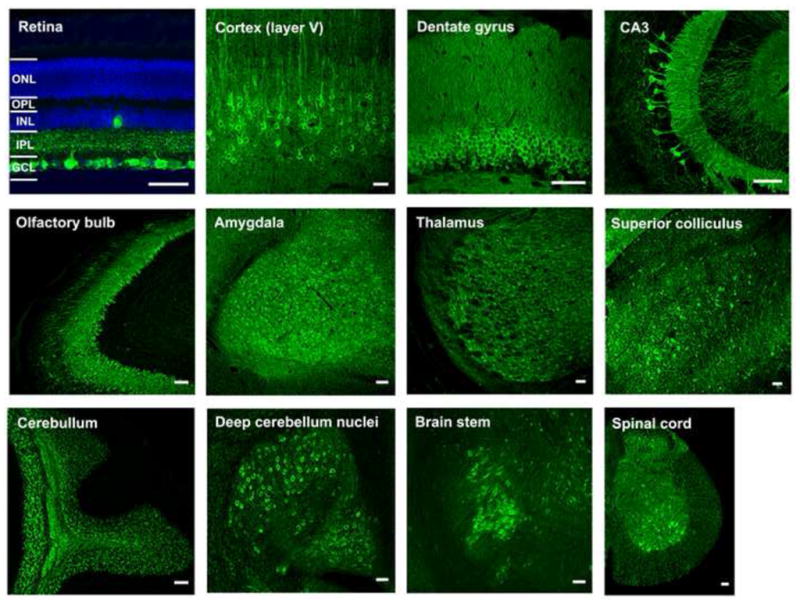
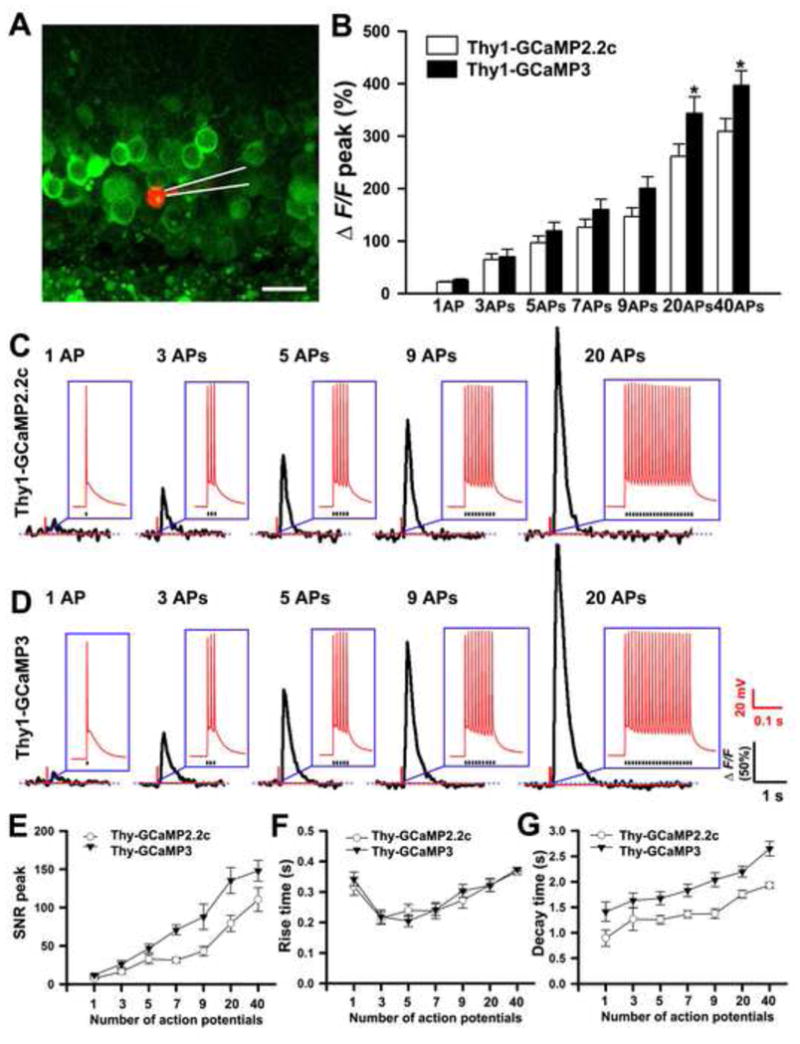
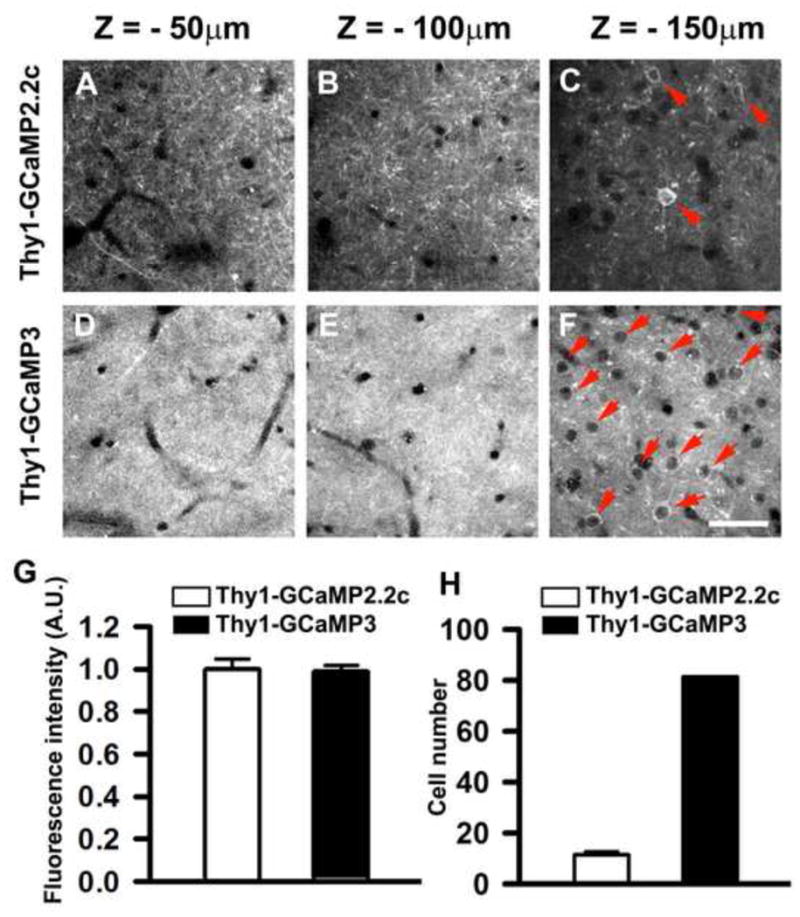
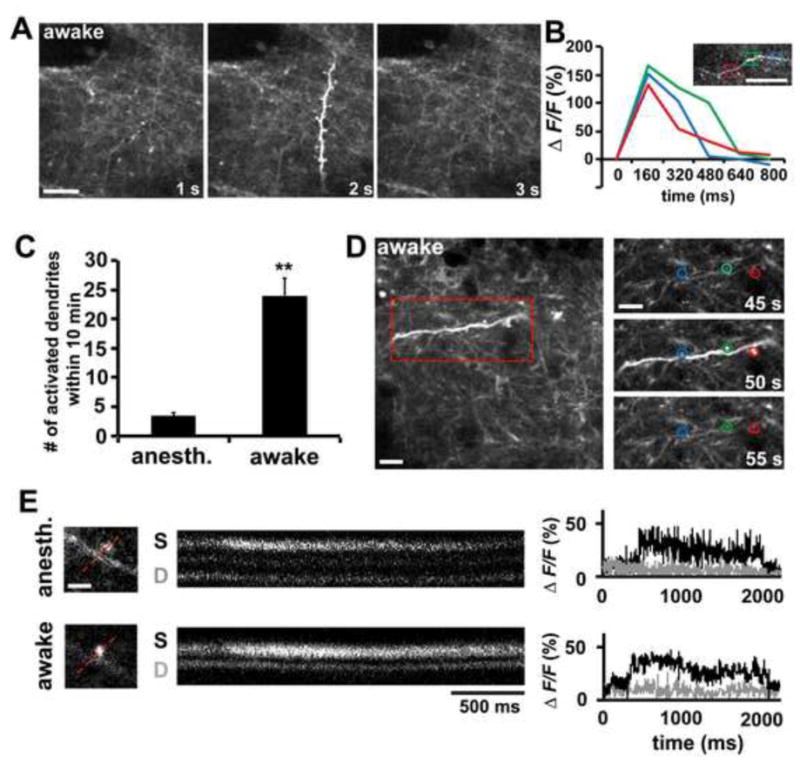
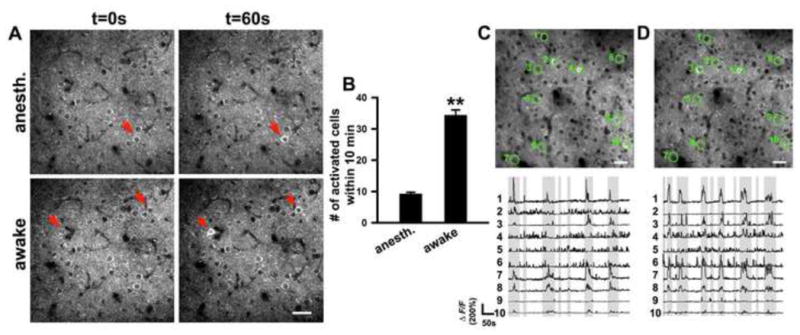
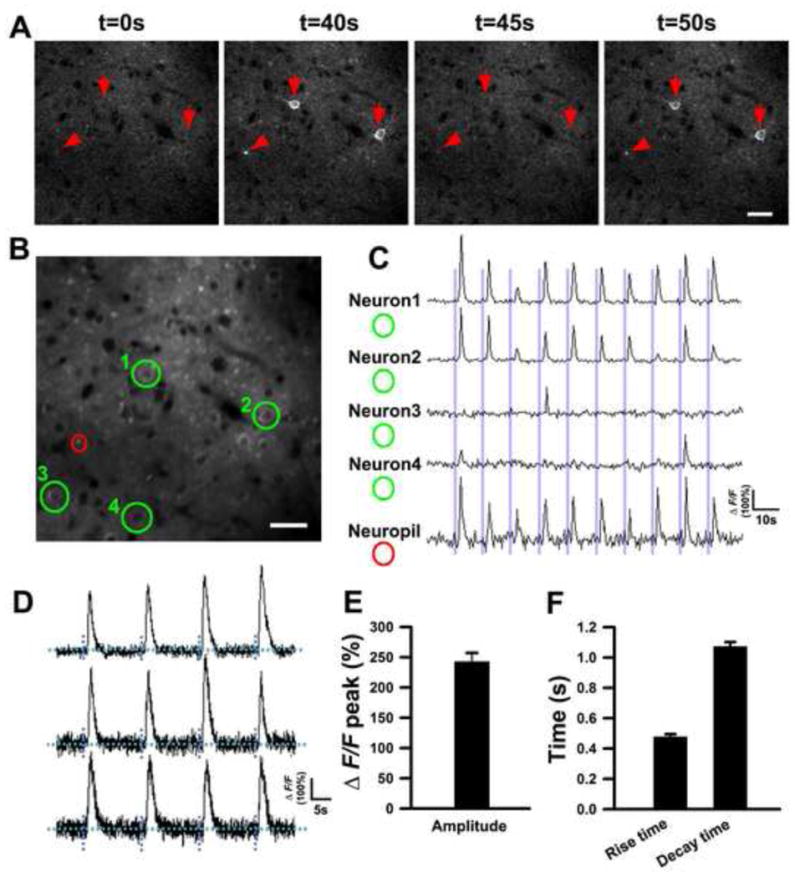
The ability to chronically monitor neuronal activity in the living brain is essential for understanding the organization and function of the nervous system. The genetically encoded green fluorescent protein-based calcium sensor GCaMP provides a powerful tool for detecting calcium transients in neuronal somata, processes, and synapses that are triggered by neuronal activities. Here we report the generation and characterization of transgenic mice that express improved GCaMPs in various neuronal subpopulations under the control of the Thy1 promoter. In vitro and in vivo studies show that calcium transients induced by spontaneous and stimulus-evoked neuronal activities can be readily detected at the level of individual cells and synapses in acute brain slices, as well as chronically in awake, behaving animals. These GCaMP transgenic mice allow investigation of activity patterns in defined neuronal populations in the living brain and will greatly facilitate dissecting complex structural and functional relationships of neural networks.


Conflict of interest statement

Competing interests statement

The authors declare no competing financial interests.

Figures

Figure 1
Figure 1. Expression patterns of Thy1-GCaMP3 transgenic mice
(A) Sagittal sections of brains from Thy1-GCaMP3 mice. GCaMP3 is highly expressed in the cortex, hippocampus, thalamus, superior colliculus, mossy fiber in the cerebellum and various nuclei in the brain stem. (B) Confocal images showing the expression in motor cortex (M1) of Thy1-GCaMP3 mouse brains. The insets (b1–b2) show a higher magnification view of layer II/III neurons in the cortex (boxed areas). GCaMP3 is expressed in most layer II/III neurons. In b1–b2, the same sections were co-stained with an antibody against the neuronal marker NeuN (red) showing the localization of GCaMP in the cytoplasm of neurons. OB: olfactory bulb; CTX: cortex; HP: hippocampus; STR: striatum; TH: Thalamus; SC: superior colliculus; CB: cerebellum; BS: brain stem. I, II, III, IV, V and VI refer to cortical layers. Scale bars, 1mm (A); 50 μm (B and b1–b2).
Figure 2
Figure 2. GCaMP fluorescence in Thy1-GCaMP3 transgenic mice showing labeling of subsets of neurons in different brain areas
Green, GCaMP fluorescence; blue, DAPI staining. GCL, ganglion cell layer; IPL, inner plexiform layer; INL, inner nuclear layer; OPL, outer plexiform layer; ONL, outer nuclear layer. Scale bar, 50 μm.
Figure 3
Figure 3. Action potential-evoked response of GCaMP2.2c and GCaMP3 in hippocampal granular cells of Thy1-GCaMP transgenic mice
(A) A granular cell patched with internal solution containing 100 μM Alexa Fluor 555 is shown in red. The recording pipette is indicated with white lines. (B) Fluorescence changes of GCaMP2.2c and GCaMP3 to different numbers of action potentials evoked at 83 Hz (n = 9 cells). (C, D) Representative ΔF/F traces to different numbers of action potentials across cells from Thy1-GCaMP2.2c and Thy1-GCaMP3 transgenic mice. The insets show the evoked action potentials from each cell. (E) Signal to noise ratio of GCaMP2.2c and GCaMP3 to different numbers of action potentials evoked at 83 Hz (n = 9 cells). (F) The means of rise time and (G) decay time of fluorescence responses corresponding to the number of stimulating action potentials (n = 9 cells). Data are presented as mean ± SEM. *p<0.05.
Figure 4
Figure 4. In vivo two photon imaging of GCaMP2.2c and GCaMP3 expressing neocortical neurons
In vivo two-photon images of GCaMP-expressing neurons in the motor cortex of 5-month-old Thy1-GCaMP2.2c (A–C) and Thy1- GCaMP3 (D–F) mice. The depth below the pial surface is shown above each panel. In Thy1-GCaMP2.2c mice, densely packed yet resolvable individual dendrites were clearly visible in the superficial layers (A and B), whereas the density of labeled dendrites was much higher in Thy1-GCaMP3 animals (D and E). Thy1-GCaMP2.2c mice had few layer II/III neurons labeled (C), whereas GCaMP3 was expressed in almost all layer II/III neurons (F). Red arrows mark individual Layer II/III neurons. See also Movie S4 and S5. (G) Quantification of brightness of neuronal somata from Thy1-GCaMP2.2c and Thy1-GCaMP3 transgenic mice 150160 μm below the pial surface, n = 75 from 3 mice). (H) Quantification of neuron number in 250 × 250 μm area from Thy1-GCaMP2.2c and Thy1-GCaMP3 transgenic mice 150160 μm below the pial surface, n = 10 from 3 mice). Data are presented as mean ± SEM. Scale bar, 50 μm.
Figure 5
Figure 5. In vivo Ca2+ imaging of apical dendrites and dendritic spines of layer V pyramidal neurons in Thy1-GCaMP2.2c transgenic mice
(A) Two-photon Ca2+ imaging of layer V apical dendrites in the motor cortex of an awake, head-fixed Thy1-GCaMP2.2c mouse (2 month-old). A representative time-lapse sequence shows a dendritic calcium transient in both the dendritic shaft and spines. (B) A representative Δ F/F tracing of a dendritic calcium transient within the apical tuft in an awake, head-fixed mouse. Three segments (red, green, and blue boxes) of the dendritic arbor were measured before and after the calcium transient. Note that the calcium transient lasts for hundreds of ms. (C) Quantification of the number of dendritic calcium transient within 10 min in a 100 μm × 100 μm imaging window under anesthetized (n = 3 mice) and awake state (n = 3 mice). (D) Dendritic calcium transient caused a transient calcium elevation in dendritic spines in motor cortex of an awake behaving mouse. Images of the same apical dendritic segment before (45s), during (50s), and after (55s) its activation are shown. The blue, green, and red circles mark the location of 3 different spines along the dendrite. See also Movie S6. (E) A transient calcium elevation could be detected in dendritic spines under anesthetized and awake states. Fluorescence images were acquired from a line-scan intersecting a spine (S) and the dendrite (D, gray trace). The increases in fluorescence indicate Ca2+ entry within the bulbous spine (black trace). Data are presented as mean ± SEM. Scale bars, 10 μm for (A and B); 5 μm for (D); 2 μm for (E). **p<0.005.
Figure 6
Figure 6. In vivo Ca2+ imaging of neuronal activity in the motor cortex with Thy1-GCaMP3 transgenic mice
(A, B) In vivo two-photon time-lapse images of layer II/III neurons in the motor cortex of 5-month-old Thy1-GCaMP3 mice. Top panel shows an example of neuronal activity in the anesthetized state. Bottom panel shows neuronal activity in the awake state. Red arrows mark activated neurons. Quantification of the number of activated neurons within 10 min in anesthetized (n = 5 areas from 3 mice) and awake state (n = 4 areas from 3 mice) is shown in B. Data are presented as mean ± SEM. **p<0.005. (C–D) Repeated imaging of calcium dynamics of layer II/III neurons in the motor cortex. (C) A raw fluorescence image of layer II/III neurons in the motor cortex of Thy1-GCaMP3 mice at 7 days after surgery (top) and ΔF/F traces of each circled neuron (bottom). Shaded part of the traces indicates that the mice were moving. (D) The fluorescence image of the same field and fluorescent traces of the same neurons as in (C) at 22 d after surgery. Scale bar, 50 μm for (A, C and D).
Figure 7
Figure 7. In vivo imaging of sensory stimulation-evoked calcium transients in the somatosensory cortex of Thy1-GCaMP3 transgenic mice
(A) In vivo two-photon time-lapse images of layer II/III neurons in the somatosensory cortex of Thy1-GCaMP3 mice. Red arrows mark activated neurons and a red arrowhead marks an activated neuronal process. (B, C) Calcium dynamics of layer II/III neurons in the somatosensory cortex. (B) shows a raw fluorescence image of layer II/III neurons. Fluorescence traces of the neurons (green circles) and neuropil (a red circle) are shown in (C). See also Movie S8. (D) Three examples of individual fluorescence traces of layer II/III neurons in the somatosensory cortex using 40 Hz scanning speed. (E) The average maximal fluorescence changes. (F) Decay time and rise time of neurons responses to a single air puff. Data are mean ± SEM. (n = 8 cells from 3 mice for E and F). Scale bars, 50 μm for (A) and (B).

Similar articles

Cited by

References

    1. Andermann ML, Kerlin AM, Roumis DK, Glickfeld LL, Reid RC. Functional specialization of mouse higher visual cortical areas. Neuron. 2011;72:1025–1039. - PMC - PubMed
    1. Arenkiel BR, Peca J, Davison IG, Feliciano C, Deisseroth K, Augustine GJ, Ehlers MD, Feng G. In vivo light-induced activation of neural circuitry in transgenic mice expressing channelrhodopsin-2. Neuron. 2007;54:205–218. - PMC - PubMed
    1. Borghuis BG, Tian L, Xu Y, Nikonov SS, Vardi N, Zemelman BV, Looger LL. Imaging light responses of targeted neuron populations in the rodent retina. J Neurosci. 2011;31:2855–2867. - PMC - PubMed
    1. Bozza T, McGann JP, Mombaerts P, Wachowiak M. In vivo imaging of neuronal activity by targeted expression of a genetically encoded probe in the mouse. Neuron. 2004;42:9–21. - PubMed
    1. Chen X, Leischner U, Rochefort NL, Nelken I, Konnerth A. Functional mapping of single spines in cortical neurons in vivo. Nature. 2011;475:501–505. - PubMed

Publication types

MeSH terms

LinkOut - more resources