. 2012 Oct 18;76(2):317-324.
doi: 10.1016/j.neuron.2012.08.040. Epub 2012 Oct 17.

Parametric functional maps of visual inputs to the tectum

Affiliations

Parametric functional maps of visual inputs to the tectum

Nikolas Nikolaou et al. Neuron. .

Erratum in

  • Neuron. 2013 Mar 6;77(5):992

Abstract

How features of the visual scene are encoded in the population activity of retinal ganglion cells (RGCs) targeting specific regions of the brain is not well understood. To address this, we have used a genetically encoded reporter of presynaptic function (SyGCaMP3) to record visually evoked activity in the population of RGC axons innervating the zebrafish tectum. Using unbiased voxel-wise analysis of SyGCaMP3 signals, we identify three subtypes of direction-selective and two subtypes of orientation-selective retinal input. Composite parametric functional maps generated across many larvae show laminar segregation of direction- and orientation-selective responses and unexpected retinotopic biases in the distribution of functional subtypes. These findings provide a systematic description of the form, organization, and dimensionality of visual inputs to the brain and will serve as a platform for understanding emergent properties in tectal circuits associated with visually driven behavior.


Figures

Figure 1
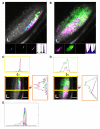
Figure 1. SyGCaMP3 Transgenic Zebrafish and Experimental Set-Up
(A–A′′) Dorsal view of a 7 dpf double transgenic Tg(Isl2b:Gal4;UAS:SyGCaMP3) zebrafish larva showing SyGCaMP3 expression in RGC axons within the tectal neuropil. DiI, injected into the right eye, labels RGC axons throughout all retinorecipient laminae in the left tectal hemisphere. Boxed region is magnified in (A′) and (A′′) (SO, stratum opticum; SFGS, stratum fibrosum et griseum superficiale; SGC, stratum griseum centrale; SAC, stratum album centrale) (L, lateral; A, anterior). (B) Larvae were immobilized in agarose and placed with one eye facing a projection screen. Visually evoked SyGCaMP3 responses were recorded in the contralateral tectum. (C) Representative percentage ΔF/F of a single voxel during a tuning experiment. Stimulus epochs are shown in gray and direction of motion is indicated by arrows. Integral responses in polar plot form are shown to the right. (D) Montage showing integral responses (grayscale) of all voxels (RGC axons) in the tectum. Direction of motion is shown on the bottom right in each panel. Orientation of the image is shown on the bottom left (P, posterior; L, lateral). Scale bars represent 50 μm in (A), 20 μm in (A′), and 20 μm in (D).
Figure 2
Figure 2. Direction-Selective Responses Are Restricted to a Superficial Layer of SFGS
(A) Voxel-wise vector sum analysis of a single larva. Voxels are color coded according to vector sum (scale shown to the right). (B) A threshold (vector sum > 0.002) applied to the map shown in (A) reveals direction-selective voxels localized to superficial regions of the tectal neuropil. Color coding represents the preferred angle. (C) Polar plots of representative voxels with highly direction-selective responses (color coding as in B). (D) Distribution of vector angles for all direction-selective voxels (23 optical sections from 9 larvae). Fitted von-Mises distributions confirm three populations of direction-selective voxels centered at 30°, 164°, and 265°. (E) Parametric map of a single larva illustrating the three populations of direction-selective responses superimposed onto the mean fluorescence image of SyGCaMP3-expressing axons. Direction-selective responses occur in a superficial layer of SFGS. White arrow indicates skin autofluorescence. (F) Preferred angles of direction-selective responses relative to the larval body axis. Arrows are scaled to reflect the relative proportion of voxels in each population. Scale bar represents 20 μm in (A), as well as in (B) and (E).
Figure 3
Figure 3. Orientation-Selective Responses Are Broadly Distributed throughout SFGS
(A) Voxel-wise analysis of 1 – circular variance from a single larva. Voxels are color coded according to 1 – circular variance (scale to the right). (B) A threshold (1 – circular variance < 0.4) applied to the map shown in (A) reveals orientation-selective voxels. Color coding represents the complex angle. (C) Polar plots showing highly orientation-selective responses in individual voxels (color coding as in B). (D) Distribution of complex angles of all orientation-selective voxels. (Data are from 23 different optical sections from 9 larvae.) Fitted bimodal von-Mises distributions reveal two populations of orientation-selective response centered at 352°(+180°) and 105°(+180°) (relative fractions of the total are 0.54 and 0.17, respectively). The baseline population represents the nontuned population of voxels responding approximately equally to all orientations (0.28). (E and F) Parametric maps of two larvae illustrating the spatial arrangement of the two populations of orientation-selective responses in the deeper portion of SFGS. White arrow indicates skin autofluorescence. (G) Preferred angles of orientation-selective responses relative to the larval body axis. Arrows are scaled to reflect relative proportion of voxels in each population. Scale bar represents 20 μm in (A), as well as in (B), (E), and (F).
Figure 4
Figure 4. Composite Maps Reveal a Laminar and Retinotopic Organization of Direction- and Orientation-Selective Responses
(A and B) Combined composite parametric maps that represent the spatial organization of responses across all subjects color coded for individual subpopulations of direction-selective (A) and orientation-selective (B) responses overlaid on an anatomical image (grayscale). Voxels that lie within ±20° of the peak of each fitted von-Mises distribution (inset histograms) are color coded and mapped on the individual (inset) and combined composite maps. (C and D) The composite maps of direction-selective (C) and orientation-selective (D) responses, respectively, are rotated to enable line plots representing the summed incidence across each axis: the area between the yellow lines represents an approximately linear segment of the neuropil to assess lamination and the area between the orange lines represents visual field to assess retinotopic organization. (E) Relative histograms of direction-selective responses and orientation-selective responses across laminar of the tectal neuropil (derived from lower line plots in C and D). Note that the area of intersection between all direction-selective (solid lines) and orientation-selective (dashed lines) voxels was only 14% of the total area—confirming the laminar segregation of direction- and orientation-selective responses. Scale bar represents 20 μm in (C) and (D).

Comment in

Similar articles

Cited by

References

    1. Ben Fredj N, Hammond S, Otsuna H, Chien CB, Burrone J, Meyer MP. Synaptic activity and activity-dependent competition regulates axon arbor maturation, growth arrest, and territory in the retinotectal projection. J. Neurosci. 2010;30:10939–10951. - PMC - PubMed
    1. Bock DD, Lee WC, Kerlin AM, Andermann ML, Hood G, Wetzel AW, Yurgenson S, Soucy ER, Kim HS, Reid RC. Network anatomy and in vivo physiology of visual cortical neurons. Nature. 2011;471:177–182. - PMC - PubMed
    1. Briggman KL, Helmstaedter M, Denk W. Wiring specificity in the direction-selectivity circuit of the retina. Nature. 2011;471:183–188. - PubMed
    1. Chklovskii DB, Koulakov AA. Maps in the brain: what can we learn from them? Annu. Rev. Neurosci. 2004;27:369–392. - PubMed
    1. Dreosti E, Odermatt B, Dorostkar MM, Lagnado L. A genetically encoded reporter of synaptic activity in vivo. Nat. Methods. 2009;6:883–889. - PMC - PubMed

Publication types

LinkOut - more resources