. 2012 Oct 18;76(2):325-37.
doi: 10.1016/j.neuron.2012.07.022. Epub 2012 Oct 17.

Genetic removal of p70 S6 kinase 1 corrects molecular, synaptic, and behavioral phenotypes in fragile X syndrome mice

Affiliations

Genetic removal of p70 S6 kinase 1 corrects molecular, synaptic, and behavioral phenotypes in fragile X syndrome mice

Aditi Bhattacharya et al. Neuron. .

Abstract

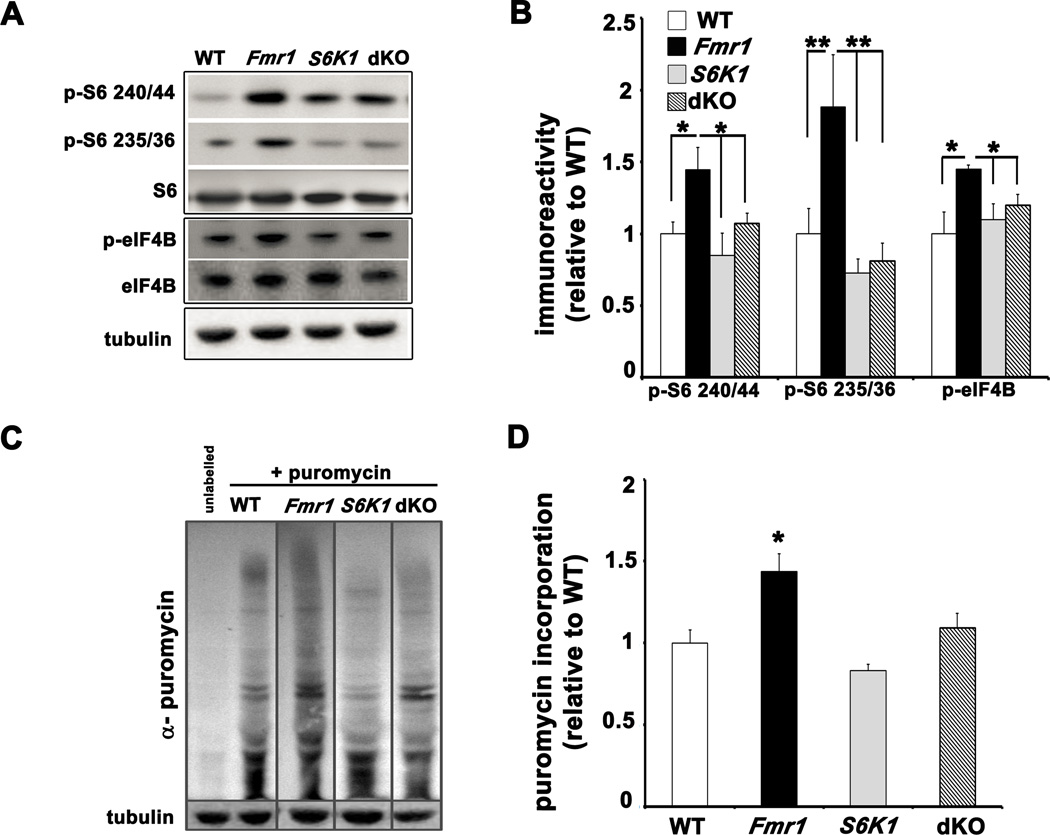
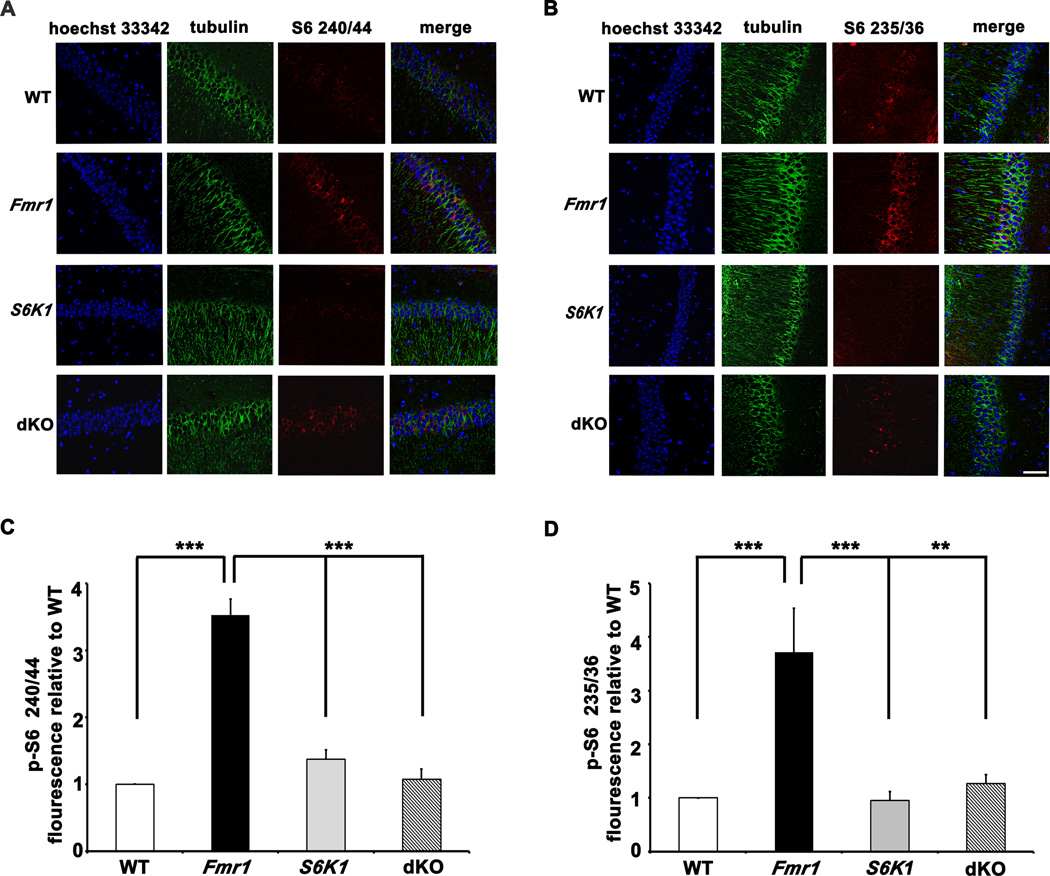
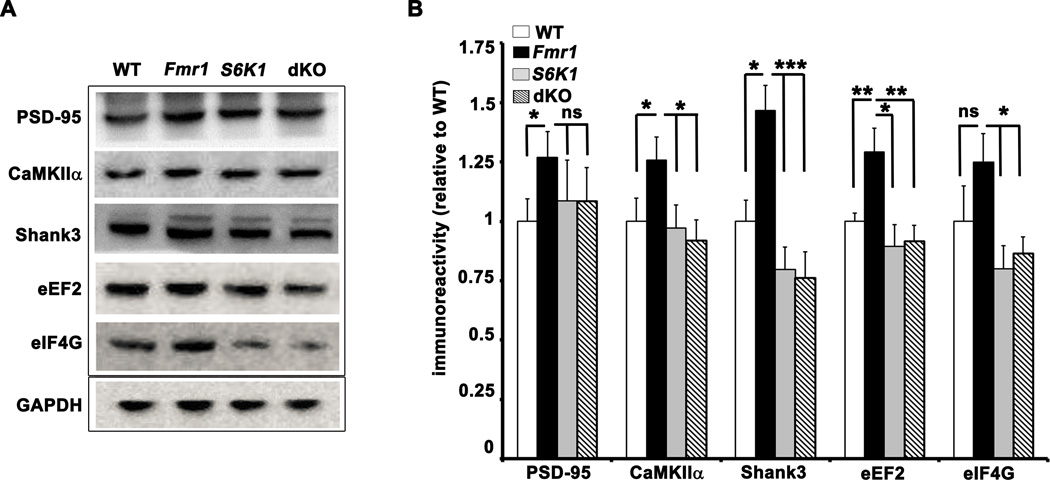
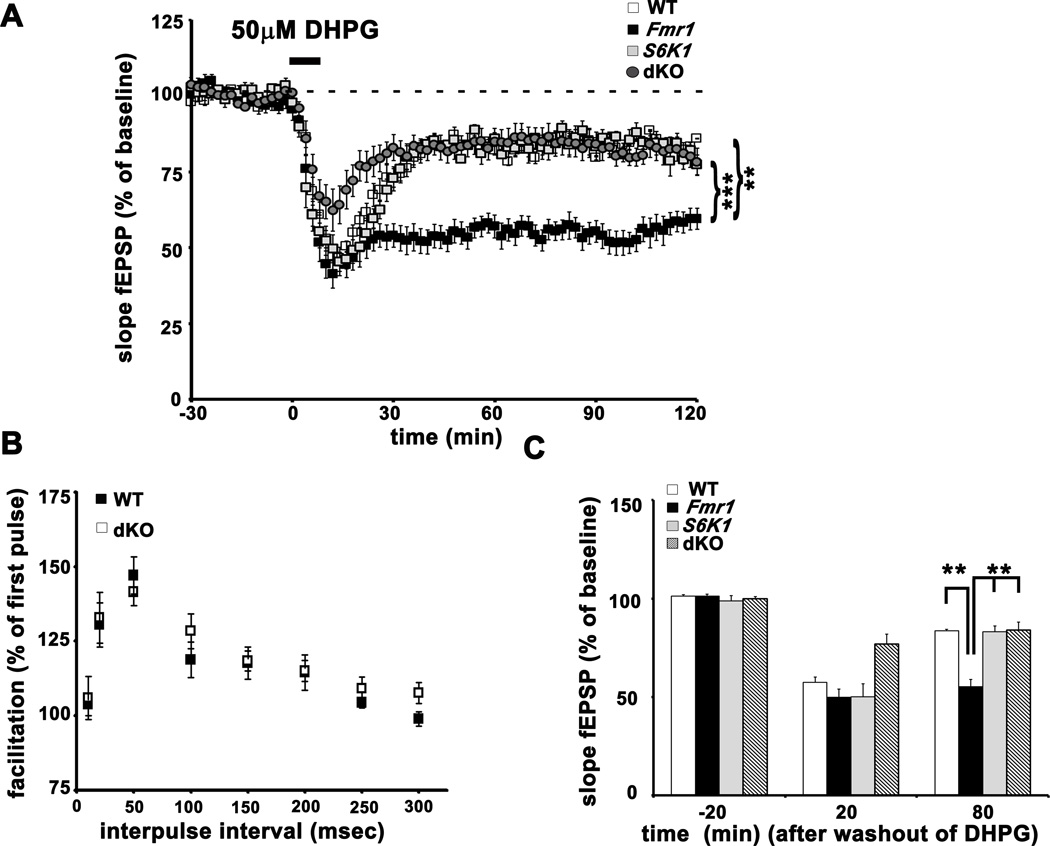
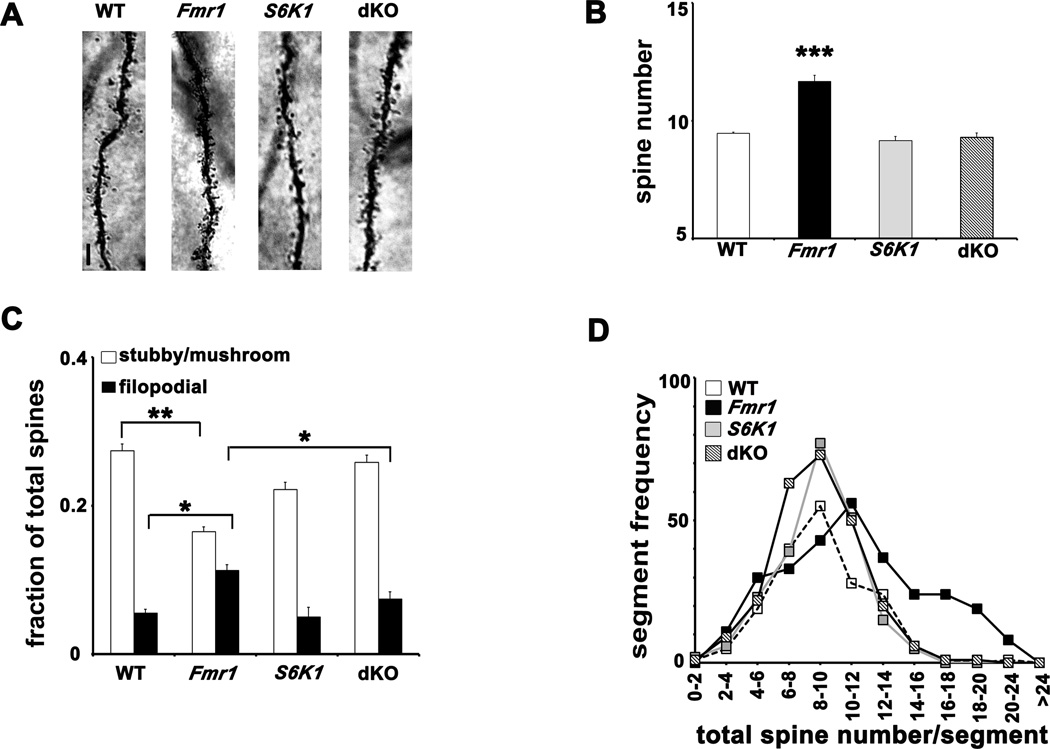
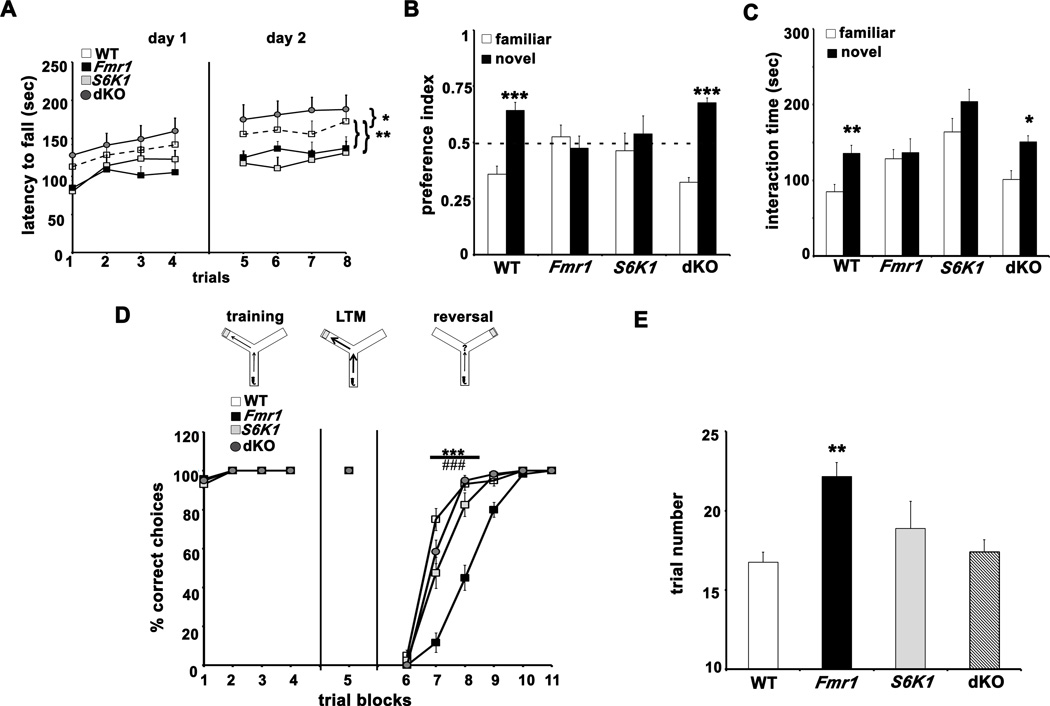
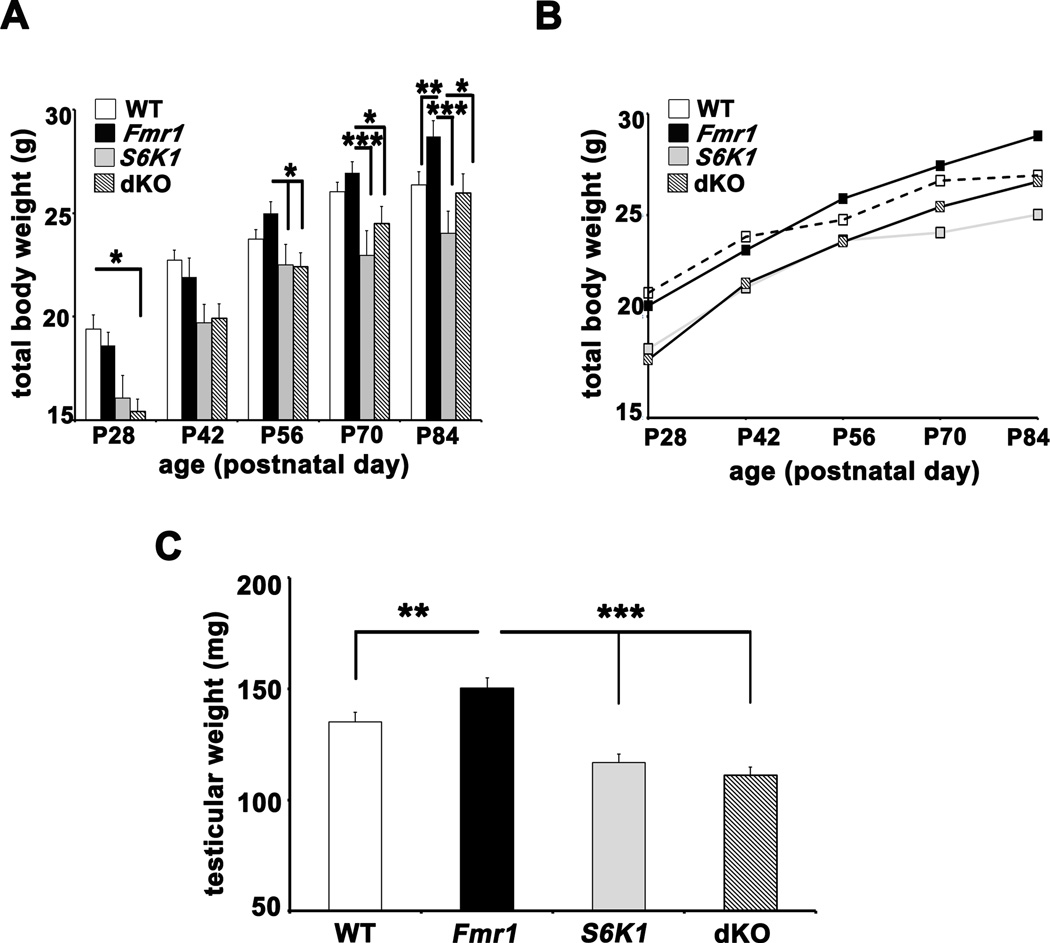
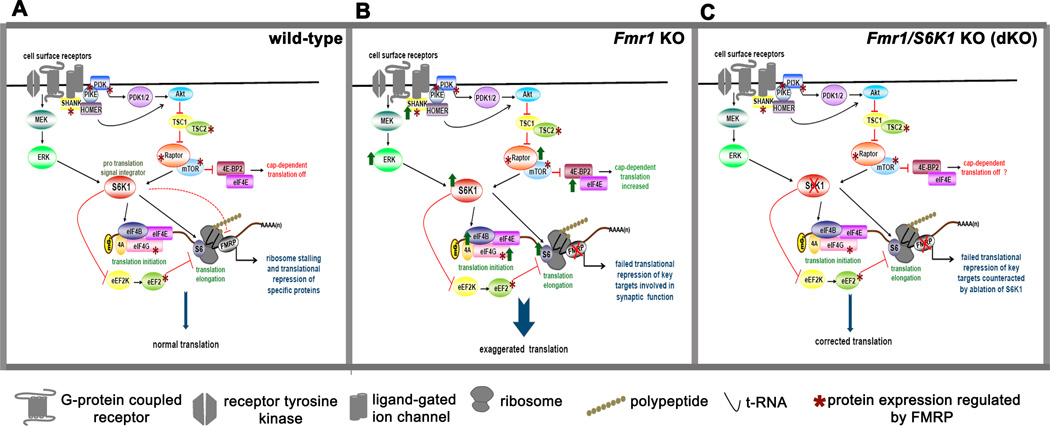
Fragile X syndrome (FXS) is the leading inherited cause of autism and intellectual disability. Aberrant synaptic translation has been implicated in the etiology of FXS, but most lines of research on therapeutic strategies have targeted protein synthesis indirectly, far upstream of the translation machinery. We sought to perturb p70 ribosomal S6 kinase 1 (S6K1), a key translation initiation and elongation regulator, in FXS model mice. We found that genetic reduction of S6K1 prevented elevated phosphorylation of translational control molecules, exaggerated protein synthesis, enhanced mGluR-dependent long-term depression (LTD), weight gain, and macro-orchidism in FXS model mice. In addition, S6K1 deletion prevented immature dendritic spine morphology and multiple behavioral phenotypes, including social interaction deficits, impaired novel object recognition, and behavioral inflexibility. Our results support the model that dysregulated protein synthesis is the key causal factor in FXS and that restoration of normal translation can stabilize peripheral and neurological function in FXS.


Figures

Figure 1
Figure 1. Increased phosphorylation of translation control molecules and exaggerated protein synthesis in Fmr1 KO mice are corrected in dKO mice
A) Representative Western blots of whole hippocampal lysates from WT, Fmr1 KO (Fmr1), S6K1 KO (S6K1) and dKO mice that were probed for basal levels of phosphorylated S6 and eIF4B. B) All ratios shown in cumulative graph were normalized first to levels of total S6 and eIF4B and then expressed relative to WT. n=9 mice for each genotype. *p<0.05 and **p<0.01 with a two-way ANOVA (Fmr1×S6K1) followed by Bonferroni post-hoc tests. C) Representative Western blots of lysates from hippocampal slices incubated with puromycin to measure basal rates of protein synthesis. Sensitivity of the SUnSET methods to detect changes in rates of protein synthesis is demonstrated in Supplementary Figure S1C. D) Cumulative graph with ratios expressed relative to WT. n=4 mice per genotype, 2–3 slices per condition; *p<0.05 by Kruskal-Wallis followed by Dunn's multiple comparisons post-hoc tests (genotypes compared to WT). Error bars denote S.E.M. Linked to Supplementary Figures S1 and S2.
Figure 2
Figure 2. Elevated phosphorylation of S6 in pyramidal neurons of area CA1 in Fmr1 KO mice is corrected in dKO mice
A and B) Representative images of hippocampal sections stained for phosphorylated S6 (240/44 and 235/36) in pyramidal neurons of area CA1. Scale bar denotes 20 µm. n=3 mice per genotype. C and D) Integrated intensity of phospho-S6- Alexa 568 signal measured across 60 neurons (10 neurons per slice, two slices per mouse) for each genotype. **p<0.01 and ***p<0.001 with a two-way ANOVA (Fmr1×S6K1) followed by Bonferroni post-hoc tests. Error bars denote S.E.M.
Figure 3
Figure 3. Effect of S6K1 deletion in Fmr1 KO mice on the protein expression levels of FMRP targets involved in synaptic plasticity and protein synthesis
A) Representative Western blots of whole hippocampal lysates from adult mice of all four genotypes showing the protein expression levels of the FMRP targets PSD-95, CaMKIIα, Shank3, eEF2, and eIF4G identified by a recent HITS-CLIP screen (Darnell et al., 2011). B) Cumulative graph with ratios expressed relative to WT. n=8–9 per protein per genotype. *p<0.05, ** p<0.01, and ***p<0.001 with a two-way ANOVA (Fmr1×S6K1) followed by Bonferroni post-hoc tests. Error bars denote S.E.M. Linked to Supplementary Figure S3.
Figure 4
Figure 4. Exaggerated mGluR-LTD in Fmr1 KO mice is reversed in dKO slices
A) DHPG-induced mGluR-LTD in hippocampal slices from WT, Fmr1, S6K1 and dKO. n=13 slices for WT, 12 slices for Fmr1 KO, S6K1 KO and dKO mice. **p<0.01 and ***p<0.001 with a repeated measures ANOVA (genotype×time) followed by Bonferroni post-hoc tests. B) Paired-pulse facilitation in slices from dKO mice was similar WT mice. Percent facilitation was calculated as a ratio of the second fEPSP to the first fEPSP with an interpulse interval ranging from 10 to 300 msec. n=10 slices WT and dKO mice. C) Mean values of the slope of the fEPSP before and after washout of DHPG. n=11 slices per genotype. ***p<0.001 with a two-way ANOVA (Fmr1×S6K1) followed by Bonferroni post-hoc tests. Error bars denote S.E.M. Linked to Supplementary Figure S4.
Figure 5
Figure 5. Aberrant dendritic morphology in area CA1 of Fmr1 KO mice is corrected in dKO mice
A) Representative images of Golgi-Cox stained CA1 apical dendrites from all four genotypes. Scale bar denotes 3 µm. B) Spine counts on apical dendrites per 10 µm. n=20–22 neurons (5 neurons per mouse, 4 mice and 180, 10 µm segments per genotype). *** p<0.001 by Kruskal-Wallis followed by Dunn’s multiple comparisons post-hoc tests (genotypes compared to WT). C) Spine morphology studies showing the fraction of filopodial and stubby/mushroom spines. n=20–22 neurons per genotype. *p<0.05, **p<0.01 with a group-wise Student’s t-test. In addition, a two-way ANOVA was used as shown in Figure S5. D) Frequency histograms representing distribution of 10 µm segments as a function of the number of spines contained in each dendrite. Error bars denote S.E.M. Linked to Supplementary Figure S5.
Figure 6
Figure 6. ASD-like behaviors in Fmr1 KO mice are corrected in dKO mice
A) Motor coordination and memory tested using the rota-rod test. *p<0.05, **p<0.01 with a repeated measures ANOVA (genotype×trial) followed by a Dunnett’s post-hoc test (WT as control group). B) Preference indices of mice towards novel object introduced in the novel object recognition test. *** p<0.001 with a paired Student's t-test (familiar vs novel for each genotype). C) Interaction time of mice with familiar and novel mice in the social novelty test. *p<0.05, ** p<0.01 with a paired Student's t-test (familiar vs novel for each genotype). D) Behavioral flexibility in the Y-maze test. *** p<0.001, WT vs. Fmr1; ### p<0.001, Fmr1 vs. dKO with a repeated measures ANOVA (genotype×trial) followed by Bonferronni post-hoc tests. E) Number of trails required by each genotype to achieve criterion in Y-maze test. **p< 0.01 with a two-way ANOVA (Fmr1×S6K1) followed by Bonferroni post-hoc tests. Error bars denote S.E.M. n=12 WT, 12 Fmr1, 8 S6K1 and 12 dKO for all tests. Linked to Supplementary Figure S6.
Figure 7
Figure 7. Excessive weight-gain and macro-orchidism in Fmr1 KO mice are corrected in dKO mice
A) Body weight data across four genotypes represented as histograms over 12 weeks. n=14–18 at P28, n=10–14 at P42, n= 10 at P56, P70 and P84. *p<0.05, **p<0.01 and ***p<0.001 with a two-way ANOVA (Fmr1×S6K1, at each time point) followed by Bonferroni post-hoc tests. B) Averaged body weight (mean only) of the four genotypes as a curve over time. C) Mean testicular weights of male mice (P90–100) of the four genotypes. n=11 for WT and Fmr1 mice; n=8 for S6K1 mice; n=10 for dKO mice. **p<0.01 and ***p<0.001 with a twoway ANOVA (Fmr1×S6K1) followed by Bonferroni post-hoc tests. Error bars denote S.E.M.
Figure 8
Figure 8. Model for regulation of translation by FMRP and S6K1
A) In wild-type mice, FMRP suppresses translation of its target mRNAs. S6K1 integrates signals from the mTORC1 and ERK1 pathways downstream of surface receptors to promote translation via its direct and indirect regulation of initiation and elongation factors. FMRP also controls the translation and expression of key signaling molecules as shown by the asterix, introducing additional feedback controls. This antagonistic interplay of FMRP and S6K1 provides a dynamic regulation of protein synthesis. B) In Fmr1 KO mice, the absence of FMRP results in exaggerated protein synthesis via upregulation of multiple upstream signaling molecules and downstream effectors involved in translational control, including S6K1, promoting feed-forward, uncontrolled translation. C) Genetic reduction of S6K1 in the Fmr1 KO mice as modeled in the dKO mice removes the net positive drive toward exaggerated protein synthesis and applies a tonic brake on the translation of subsets of FMRP-regulated RNA, which resets de novo protein synthesis to levels similar to that in wild-type mice. It is likely that the restoration of normal translation occurs via non-canonical signaling mechanisms.

References

    1. Antion MD, Hou L, Wong H, Hoeffer CA, Klann E. mGluR-dependent longterm depression is associated with increased phosphorylation of S6 and synthesis of elongation factor 1A but remains expressed in S6K-deficient mice. Mol. Cell. Biol. 2008a;28:2996–3007. - PMC - PubMed
    1. Antion MD, Merhav M, Hoeffer CA, Reis G, Kozma SC, Thomas G, Schuman EM, Rosenblum K, Klann E. Removal of S6K1 and S6K2 leads to divergent alterations in learning, memory, and synaptic plasticity. Learn. Mem. 2008b;15:29–38. - PMC - PubMed
    1. Aslan JE, Tormoen GW, Loren CP, Pang J, McCarty OJ. S6K1 and mTOR regulate Rac1-driven platelet activation and aggregation. Blood. 2011;118:3129–3136. - PMC - PubMed
    1. Auerbach BD, Osterweil EK, Bear MF. Mutations causing syndromic autism define an axis of synaptic pathophysiology. Nature. 2011;480:63–68. - PMC - PubMed
    1. Bear MF, Huber KM, Warren ST. The mGluR theory of fragile X mental retardation. Trends Neurosci. 2004;27:370–377. - PubMed

Publication types

MeSH terms

Substances