. 2012 Oct 18;76(2):338-52.
doi: 10.1016/j.neuron.2012.08.003. Epub 2012 Oct 17.

Slit/Robo signaling modulates the proliferation of central nervous system progenitors

Affiliations

Slit/Robo signaling modulates the proliferation of central nervous system progenitors

Víctor Borrell et al. Neuron. .

Abstract

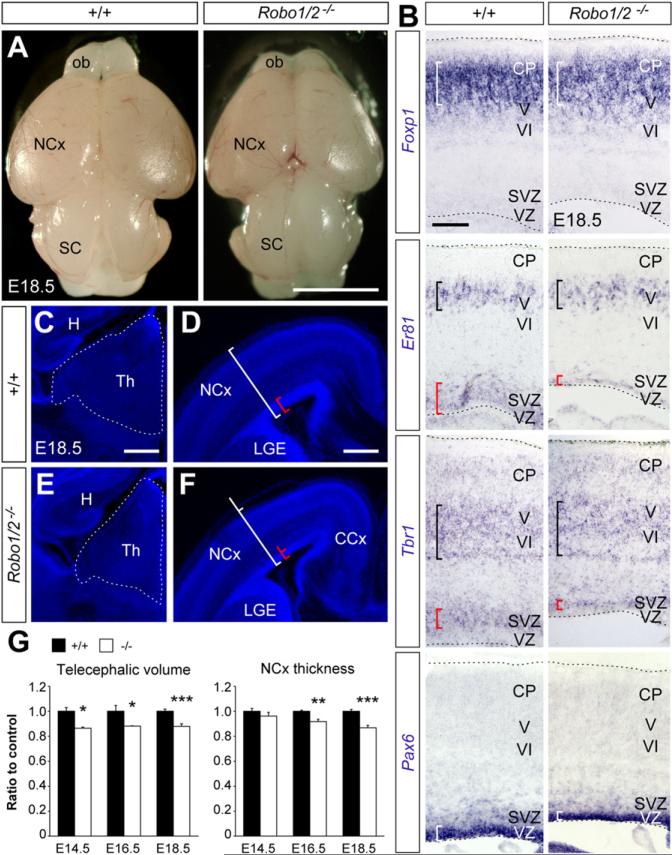
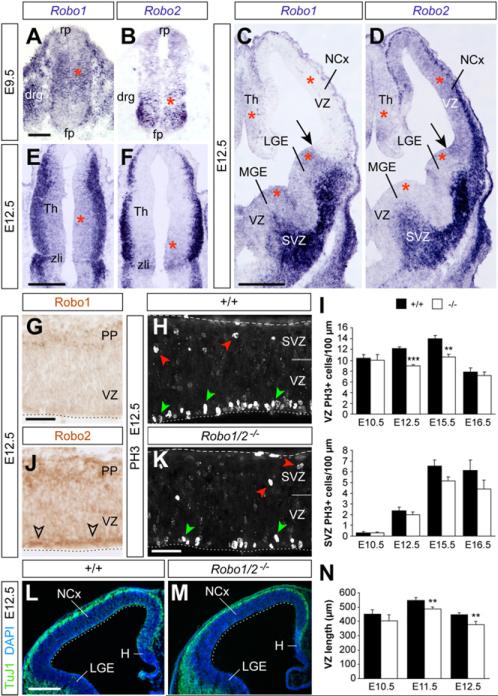
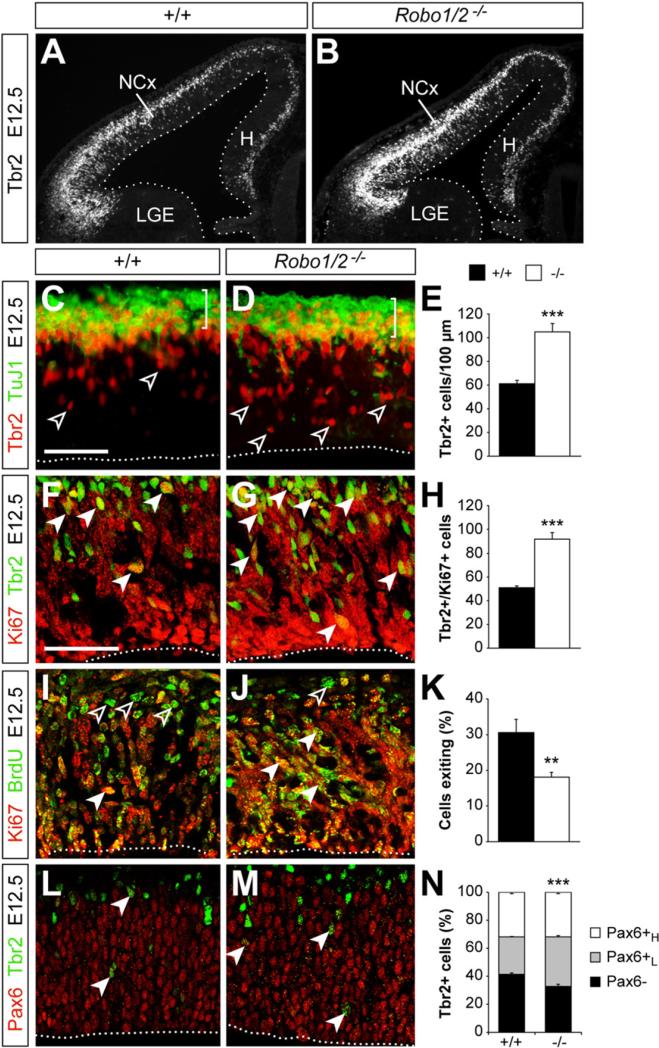
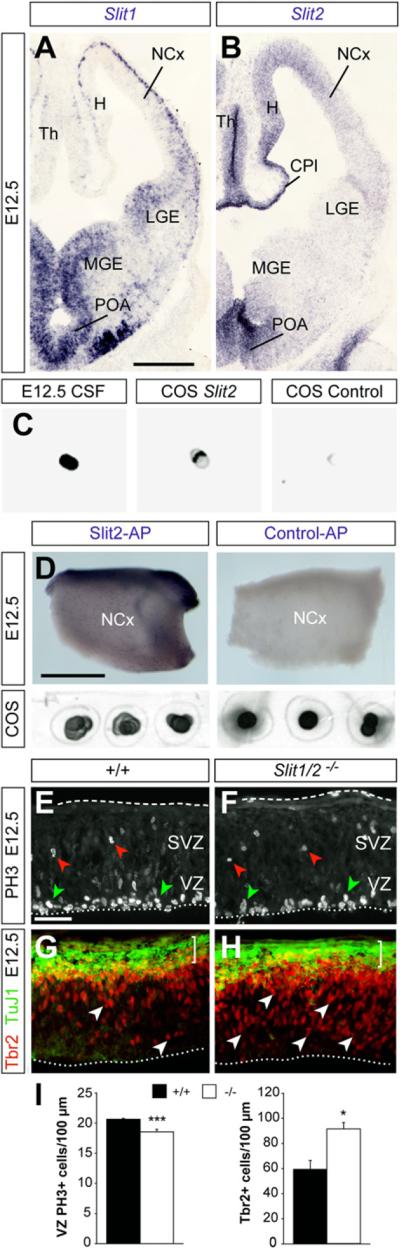
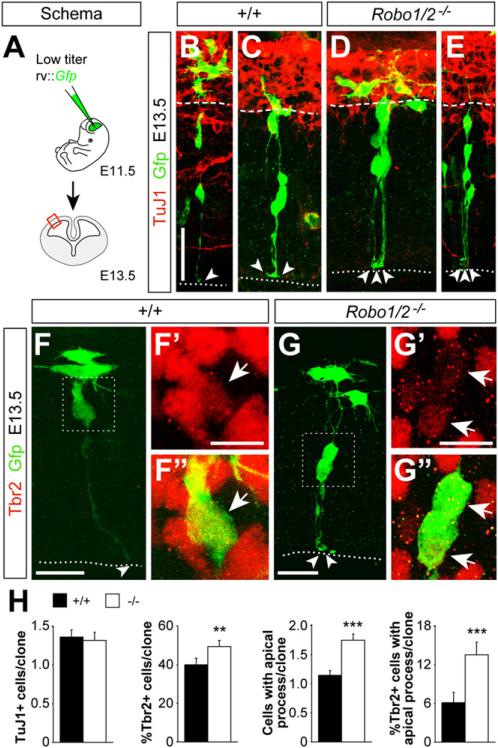
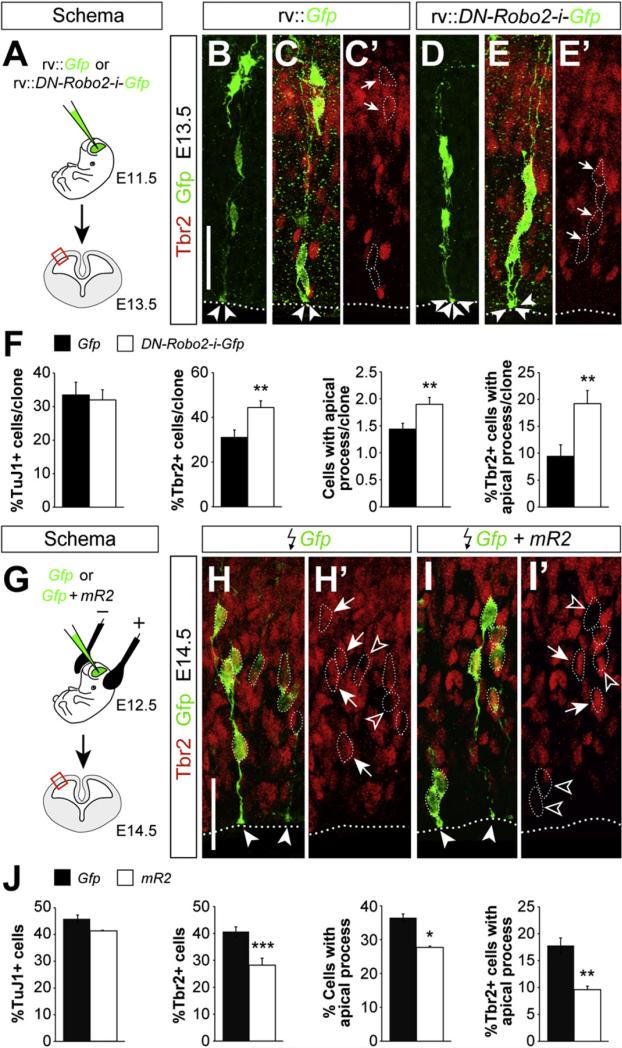
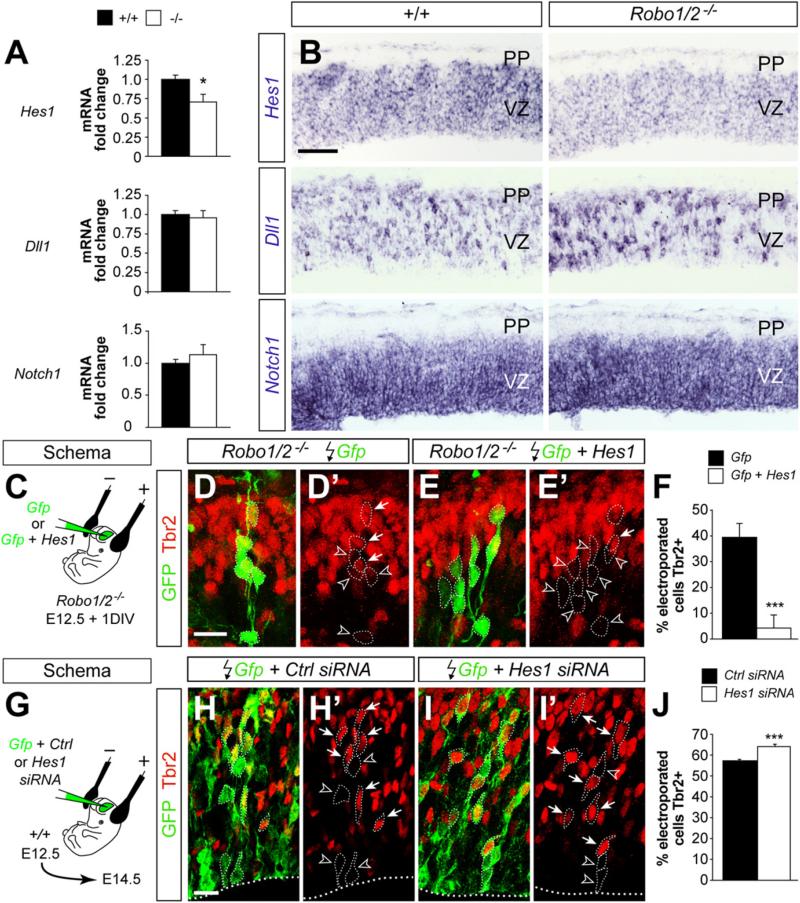
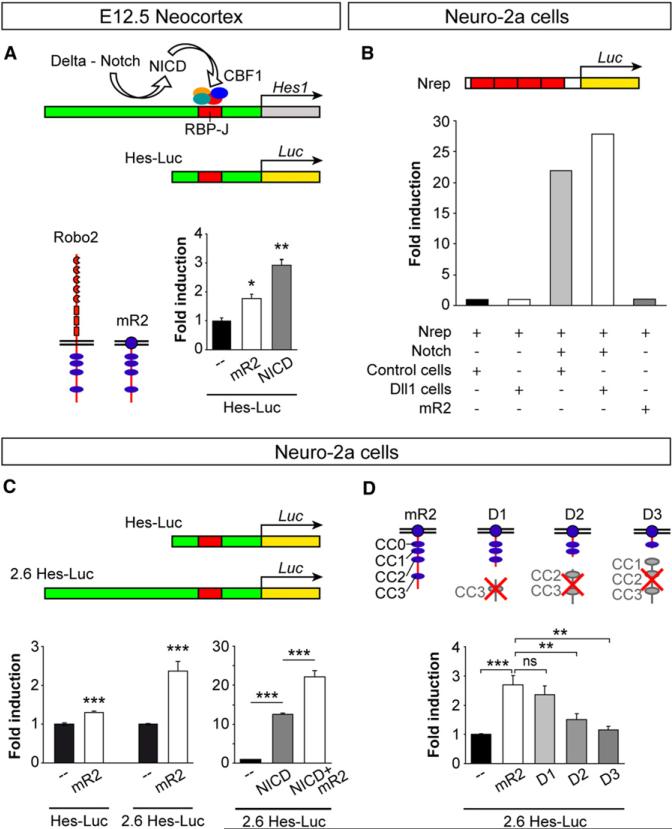
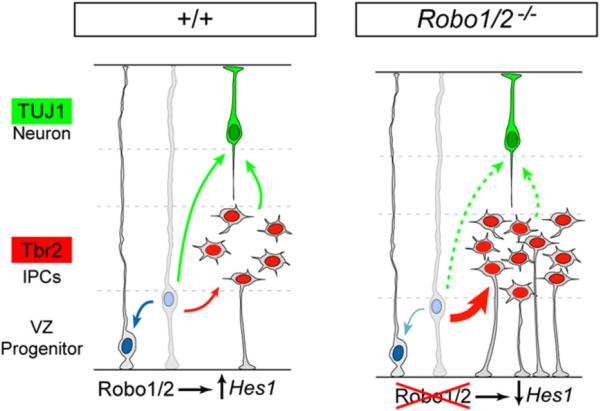
Neurogenesis relies on a delicate balance between progenitor maintenance and neuronal production. Progenitors divide symmetrically to increase the pool of dividing cells. Subsequently, they divide asymmetrically to self-renew and produce new neurons or, in some brain regions, intermediate progenitor cells (IPCs). Here we report that central nervous system progenitors express Robo1 and Robo2, receptors for Slit proteins that regulate axon guidance, and that absence of these receptors or their ligands leads to loss of ventricular mitoses. Conversely, production of IPCs is enhanced in Robo1/2 and Slit1/2 mutants, suggesting that Slit/Robo signaling modulates the transition between primary and intermediate progenitors. Unexpectedly, these defects do not lead to transient overproduction of neurons, probably because supernumerary IPCs fail to detach from the ventricular lining and cycle very slowly. At the molecular level, the role of Slit/Robo in progenitor cells involves transcriptional activation of the Notch effector Hes1. These findings demonstrate that Robo signaling modulates progenitor cell dynamics in the developing brain.


Figures

Figure 1
Figure 1. Reduced Size of Brain Structures in Robo1/2 Mutants at E18.5
(A) External view of brains from control and mutant embryos. Note the reduced size of the neocortex (NCx) and olfactory bulb. (B) Patterns of mRNA expression for Foxp1, Er81, Tbr1, and Pax6 in the cerebral cortex of control and mutant embryos. White and black brackets indicate the thickness and position of the neuronal layers with the darkest stain; red brackets indicate thickness of the proliferative layer as revealed by the dim stain. (C–F) Coronal sections of the thalamus (C and E) and NCx (D and F) in control and mutants stained with DAPI. White and red brackets serve as reference of the thickness of the neocortex and proliferative layer seen in controls. (G) Quantification of brain morphometric parameters between E14.5 and E18.5 in control (+/+) and mutants (-/-). Values are expressed as relative to measurements in control embryos; mean ± SEM (n = 4–11 embryos per group), t test, *p < 0.05; **p < 0.01; ***p < 0.001. Scale bars equal 3 cm (A), 200 μm (B), and 350 μm (C–F). CCx, cingulated cortex; H, hippocampus; ob, olfactory bulb; SC, superior colliculus; Th, thalamus. See also Figure S1.
Figure 2
Figure 2. Robo1 and Robo2 Are Expressed in CNS Progenitors and Are Required to Sustain Ventricular Mitosis
(A–F) Coronal sections through the spinal cord (A and B), telencephalon (C and D), and thalamus (E and F), showing expression of Robo1 and Robo2 mRNA at the indicated ages. Arrows point at the pallial-subpallial boundary. Red asterisks mark progenitor regions. (G and J) Immunohistochemistry for Robo1 and Robo2 in the E12.5 NCx. (H and K) PH3 stains in the E12.5 neocortex of control and mutant embryos. Green arrowheads indicate VZ mitoses; red arrowheads indicate SVZ mitoses. (I) Quantification of linear density of PH3+ nuclei in the VZ and SVZ of controls (+/+) and Robo1/2 mutants (-/-) at different stages; mean ± SEM (n = 4–6 embryos per group). (L and M) TuJ1/DAPI stains in the E12.5 NCx of control and mutant embryos. (N) Quantification of the length of the pallial VZ, as indicated by the dotted lines in (L) and (M). Mean ± SEM (n = 4–7 embryos per group). t test; **p < 0.01; ***p < 0.001. Scale bars equal 50 μm (A and B), 500 μm (C–F, L and M), and 100 μm (G–K). drg, dorsal root ganglion; fp, floor plate; PP, preplate; rp, roof plate; zli, zonal limitans intrathalamica. See also Figures S2 and S3.
Figure 3
Figure 3. Robo Receptors Modulate the Dynamics of Cortical Intermediate Progenitors
Tbr2 expression in the cortex of control and mutant embryos at E12.5 (A and B). Distribution of TuJ1+ neurons and Tbr2+ cells (C and D), cycling Tbr2+/Ki67+ cells (F and G), cell exiting cycle exit (I and J), and Tbr2/Pax6 coexpression (L and M) in the NCx of control and mutant embryos at E12.5. Open arrowheads indicate Tbr2+ cells (C and D) or Ki67–/BrdU+ cells (I and J). Solid arrowheads point to Ki67+/Tbr2+ double-labeled cells (F and G), Ki67+/BrdU+ double-labeled cells (I and J), and Pax6+/Tbr2+ double-labeled cells (L and M). For Ki67/BrdU experiments, BrdU was injected 24 hr prior to sacrifice. Quantification of the density of Tbr2+ cells (E), the density of Tbr2+/Ki67+ cells (H), the fraction of cells exiting the cell cycle (K), and the fraction of Tbr2+ cells expressing Pax6 at high (Pax6H) or low levels (Pax6L) (N) in control and Robo1/2 mutants. Mean ± SEM (n = 4–5 animals per group). For cell-cycle exit (K) and % Tbr2+ cells (N), χ2-test; for all other comparisons, t test; **p < 0.01; ***p < 0.001. Scale bars equal 50 μm. See also Figures S4 and S6.
Figure 4
Figure 4. Altered Neurogenesis in the Cortex of Slit1/2 Mutants
(A and B) Coronal sections through the telencephalon, showing expression of Slit1 and Slit2 mRNA at E12.5. (C) Dot blot analysis of Robo ligands in the CSF of E12.5 mouse embryos. (D) Open-book preparation of whole telencephalic hemispheres stained for alkaline phosphatase enzyme with Slit2-AP or control AP probes. Dot blots reveal that the level of AP expression in COS cells transfected with Slit2-AP or control-AP is similar. (E and F) PH3 stains in the NCx in control and Slit1/2 mutant embryos at E12.5. Green and red arrowheads indicate PH3+ nuclei in the VZ and SVZ, respectively. (G and H) Tbr2 stains in the NCx of control and Slit1/2 mutant embryos at E12.5. Open arrowheads point to IPCs. (I) Quantification of the density of PH3+ nuclei in the VZ and Tbr2+ nuclei in control and Slit1/2 mutants. Mean ± SEM (n = 3–5 embryos per group). t test, *p < 0.05; ***p < 0.001. CPl, choroid plexus; H, hippocampus; POA, preoptic area. Scale bars equal 250 μm. See also Figure S5.
Figure 5
Figure 5. Clonal Analysis of Progenitor Dynamics in Robo1/2 Mutants
(A) Experimental paradigm used for cortical progenitor clonal analysis. (B–G″) Analysis of individual clones in the E13.5 neocortex of control and mutant embryos labeled after retrovirus injection at E11.5. Within clones, cells were classified for TuJ1 (B–E) and Tbr2 (F–G″) immunoreactivity. The intensity of Tbr2 staining was very variable, but even cells with low Tbr2 levels were clearly distinguishable from nearby negative cells. Boxes in (F) and (G) indicate areas shown in (F′) and (F″) and (G′) and (G″), respectively. Dotted lines delineate the ventricular border, dashed lines delineate the border between TuJ1+ and TuJ1 cells, and arrowheads indicate the end feet of apical processes. (H) Quantification of the number of TuJ1+ cells, percent of Tbr2+ cells, number of cells with an apical process, and percent of Tbr2+ cells with an apical process, per cortical clone. Mean ± SEM (n = 206 control clones from five different embryos; n = 186 mutant clones from four different embryos). For Tbr2+ cells, and Tbr2+ cells with apical process in clones, χ2-test; for all other comparisons, t test. **p < 0.01; ***p < 0.001. Scale bars equal 30 μm (B and E), 20 μm (C and D), 15 μm (F and G), and 7 μm (F′, F″, G′, and G″). See also Figure S7.
Figure 6
Figure 6. Robo Signaling Influences the Generation of IPCs in a Cell-Autonomous Manner
(A) Experimental paradigm used for the analysis of cell autonomy. (B–E″) Analysis of individual clones in the E13.5 neocortex of wild-type embryos labeled after control (rv::Gfp) or dominant negative Robo2 (rv::DN-Robo2-ires-Gfp) retrovirus injection at E11.5. Within individual clones, cells were classified for TuJ1 and Tbr2 (B–E′) immunoreactivity, as well as for the presence of an apical process. Dotted lines delineate the ventricular border, arrows point to Tbr2+ cells, and arrowheads indicate the end feet of apical processes. (F) Quantification of the number of TuJ1+ cells, percent of Tbr2+ cells, number of cells with an apical process, and percent of Tbr2+ cells with an apical process, per cortical clone. Mean ± SEM (Gfp: n = 107 clones from three different embryos; DN-Robo2: n = 148 clones from four different embryos). (G) Experimental paradigm used for the analysis of gain of function. (H–I′) Coronal sections through the cortex of E14.5 wild-type embryos showing Gfp and Tbr2 stains after electroporation with Gfp or Gfp + mR2 at E12.5. Images are full stacks of confocal planes. Arrows and open arrowheads point to Tbr2+ and Tbr2– cells, respectively, as assessed from individual confocal plane images. Solid arrowheads indicate the end feet of apical processes. (J) Quantification of the number of TuJ1+ cells, percent of Tbr2+ cells, number of cells with an apical process, and percent of Tbr2+ cells with an apical process among the electroporated (Gfp+) cells. Mean ± SEM (Gfp: n = 1533 cells from five different embryos; Gfp + mR2: n = 1462 cells from three different embryos). For Tbr2+ cells and Tbr2+ cells with apical process in clones, χ2-test; for all other comparisons, t test. *p < 0.05; **p < 0.01; ***p < 0.001. Scale bars equal 40 μm (B–E′) and 30 μm (H–I′).
Figure 7
Figure 7. Robo Signaling Is Required for Normal Hes1 mRNA Expression
(A) qPCR measurements of Hes1, Dll1, and Notch1 mRNA expressed as values relative to control embryos (n = 3–5 embryos per group). t test. *p < 0.05. (B) Coronal sections of the neocortex of E12.5 control and Robo1/2 mutant embryos showing expression of Hes1, Dll1, and Notch1 mRNA. (C) Experimental paradigm used for rescue experiments. (D–E′) Coronal sections through the cortex of E12.5 + 1DIV Robo1/2 mutant embryos showing GFP and Tbr2 stains after electroporation with Gfp or Gfp + Hes1. Images are full stacks of confocal planes. Arrows and arrowheads point to Tbr2+ and Tbr2– cells, respectively, as assessed from individual confocal plane images. (F) Quantification of the fraction of Tbr2+ cells present among the Gfp electroporated population. Tbr2+/Gfp+ cell ratio, Gfp: 39.2 ± 5.6%, n = 628 cells from three different animals; Gfp + Hes1: 4.3 ± 1.3%, n = 1035 cells from three different animals. Mean ± SEM; χ2-test, ***p < 0.001. (G) Experimental paradigm used for RNAi experiments. (H–I′) Coronal sections through the cortex of E14.5 wild-type embryos showing Gfp and Tbr2 stains after electroporation with Gfp or Gfp + Hes1 siRNA. Images are full stacks of confocal planes. Arrows and arrowheads point to Tbr2+ and Tbr2– cells, respectively, as assessed from individual confocal plane images. (J) Quantification of the fraction of Tbr2+ cells present among the Gfp electroporated population. Tbr2+/Gfp+ cell ratio, Gfp: 57.3 ± 0.6%, n = 2354 cells from three different animals; Gfp + Hes1: 64.1 ± 1.1%, n = 1949 cells from four different animals. Mean ± SEM; χ2-test, ***p < 0.001. Scale bar equals 100 μm (B), 25 μm (D–E′), and 15 μm (H–I′). See also Figure S8.
Figure 8
Figure 8. Robo Signaling Drives Hes1 Transcription
(A) In the developing brain, delta-mediated processing of Notch releases NICD, which interacts with a transcription factor complex that includes CBF1 to activate Hes1 transcription through RBP-J consensus sequences. The Hes-Luc construct tested contains an RBP-J sequence. Schemas depict the basic structure of full-length Robo2 and the myristoylated version of Robo2 (mR2). The histogram shows fold induction of luciferase (Luc) activity from the Hes-Luc construct in E12.5 cortical primary cultures after transfection with mR2 or NICD. Mean ± SEM; t test, *p < 0.05; **p < 0.01. (B) Hes1 transcription is not activated in Neuro-2a cells upon transstimulation of the Notch pathway with delta. Activation of Hes1 transcription was assayed with a Notch reporter construct (Nrep) containing four RBP-J repeats. (C) Two different Hes-Luc constructs were used with Neuro-2a cells: Hes-Luc and 2.6 Hes-Luc; the latter includes a long 5 ft region. The graphs show fold induction of Hes-Luc and 2.6 Hes-Luc lucif-erase activities after transfection of Neuro-2a cells with mR2, NICD, or NICD+mR2. Mean ± SEM; t test, ***p < 0.001. (D) Structure of mR2 and three truncated forms (D1, D2, and D3) and fold induction of 2.6 Hes-Luc luciferase activity in Neuro-2a cells. Statistical significance indicated for mR2 is with respect to basal activity; all others relate to mR2. In addition, D2 values, but not D3, were significantly different than basal values. Mean ± SEM; t test, **p < 0.01; ***p < 0.001.
Figure 9
Figure 9. A Model of the Function of Robo Signaling on the Dynamics of Telencephalic Progenitors
In normal development (+/+), Robo signaling drives Hes1 transcription in neocortical VZ progenitors, which contributes to maintain the balance between VZ progenitor self-renewal (blue arrow), generation of Tbr2+ IPCs (red arrow), and generation of TUJ1+ neurons (green arrows). In the absence of Robo receptors (Robo1/2-/-), Hes1 mRNA levels decrease and the dynamics of VZ progenitors are unbalanced, favoring the generation of IPCs over self-renewal. For unknown reasons, a large proportion of Robo1/2 mutant IPCs retain a ventricle-contacting apical process and stall before entering into mitosis, which indirectly prevents the premature overproduction of neurons in Robo1/2 mutants.

References

    1. Andrews W, Barber M, Hernadez-Miranda LR, Xian J, Rakić S, Sundaresan V, Rabbitts TH, Pannell R, Rabbitts P, Thompson H, et al. The role of Slit-Robo signaling in the generation, migration and morphological differentiation of cortical interneurons. Dev. Biol. 2008;313:648–658. - PubMed
    1. Arai Y, Pulvers JN, Haffner C, Schilling B, Nüsslein I, Calegari F, Huttner WB. Neural stem and progenitor cells shorten S-phase on commitment to neuron production. Nat. Commun. 2011;2:154. - PMC - PubMed
    1. Bagri A, Marín O, Plump AS, Mak J, Pleasure SJ, Rubenstein JL, Tessier-Lavigne M. Slit proteins prevent midline crossing and determine the dorsoventral position of major axonal pathways in the mammalian forebrain. Neuron. 2002;33:233–248. - PubMed
    1. Bai G, Chivatakarn O, Bonanomi D, Lettieri K, Franco L, Xia C, Stein E, Ma L, Lewcock JW, Pfaff SL. Presenilin-dependent receptor processing is required for axon guidance. Cell. 2011;144:106–118. - PMC - PubMed
    1. Bashaw GJ, Kidd T, Murray D, Pawson T, Goodman CS. Repulsive axon guidance: Abelson and Enabled play opposing roles down-stream of the roundabout receptor. Cell. 2000;101:703–715. - PubMed

Publication types

MeSH terms