. 2012 Oct 18;76(2):370-82.
doi: 10.1016/j.neuron.2012.07.029. Epub 2012 Oct 17.

Calcium feedback to cGMP synthesis strongly attenuates single-photon responses driven by long rhodopsin lifetimes

Affiliations

Calcium feedback to cGMP synthesis strongly attenuates single-photon responses driven by long rhodopsin lifetimes

Owen P Gross et al. Neuron. .

Erratum in

  • Neuron. 2013 Jun 5;78(5):949

Abstract

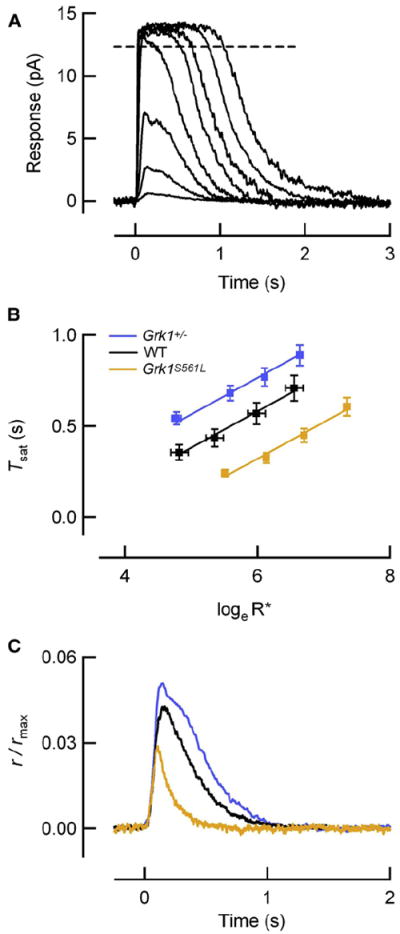
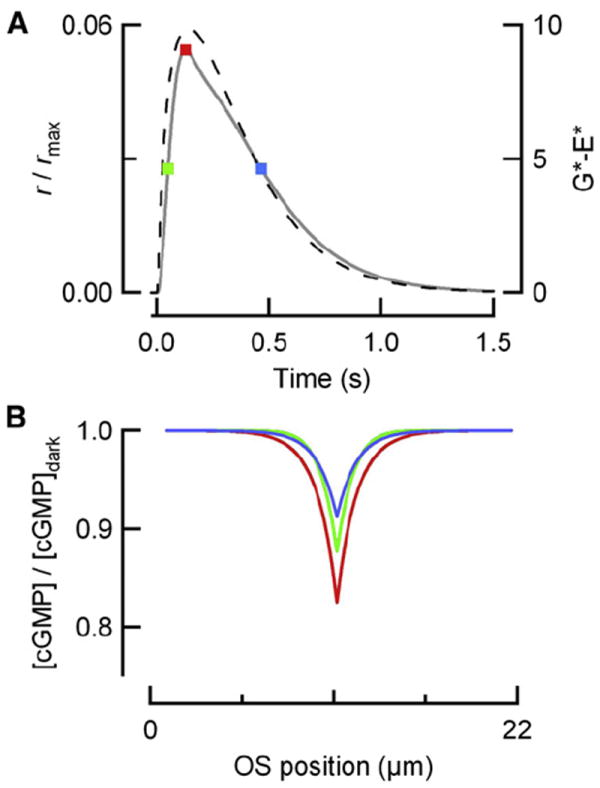
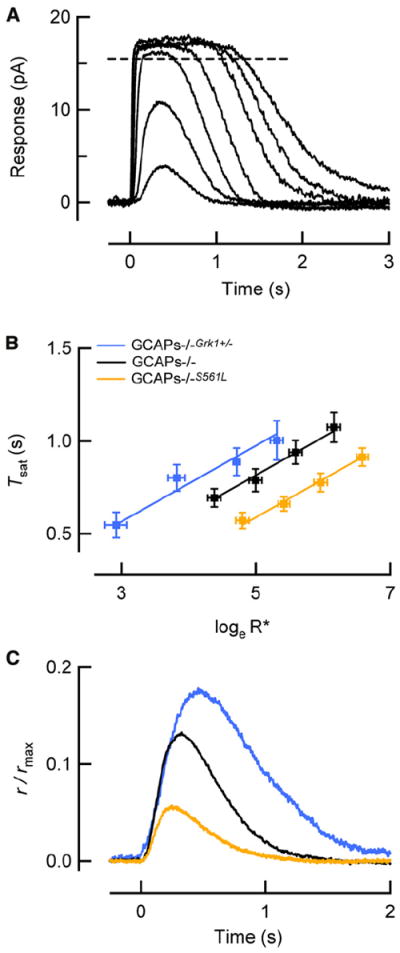
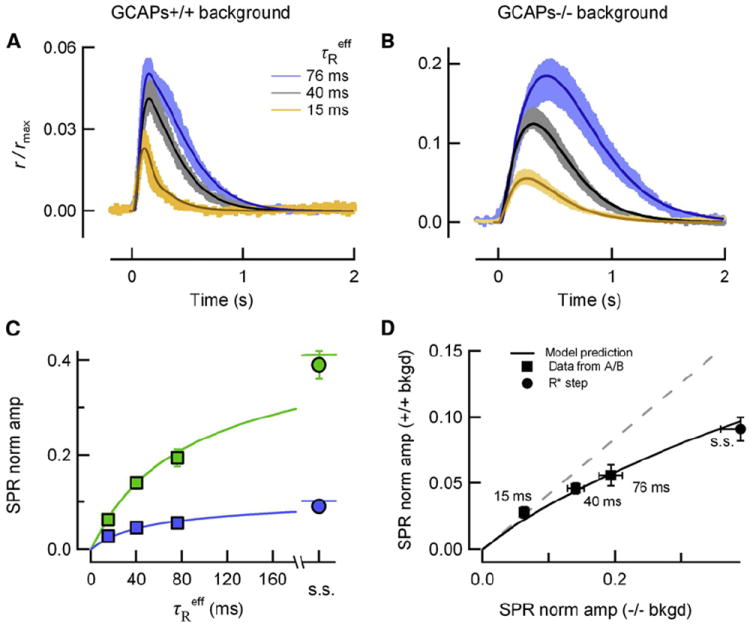
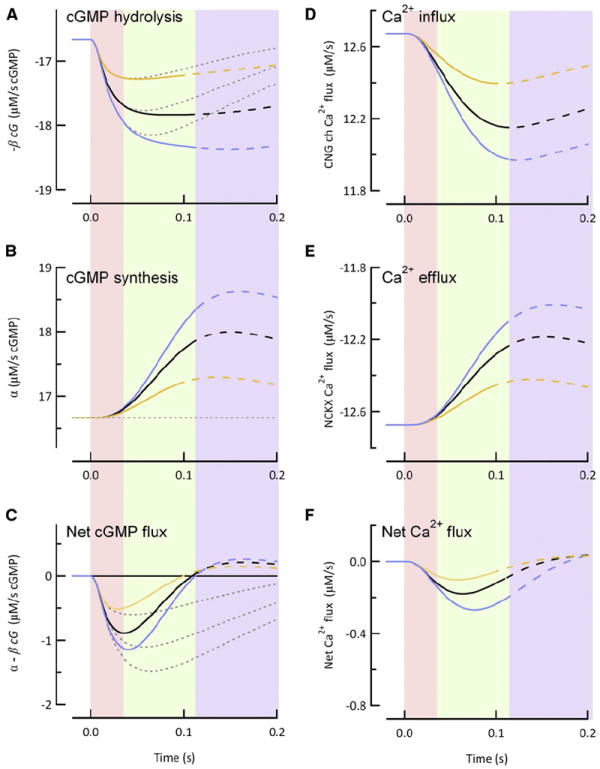
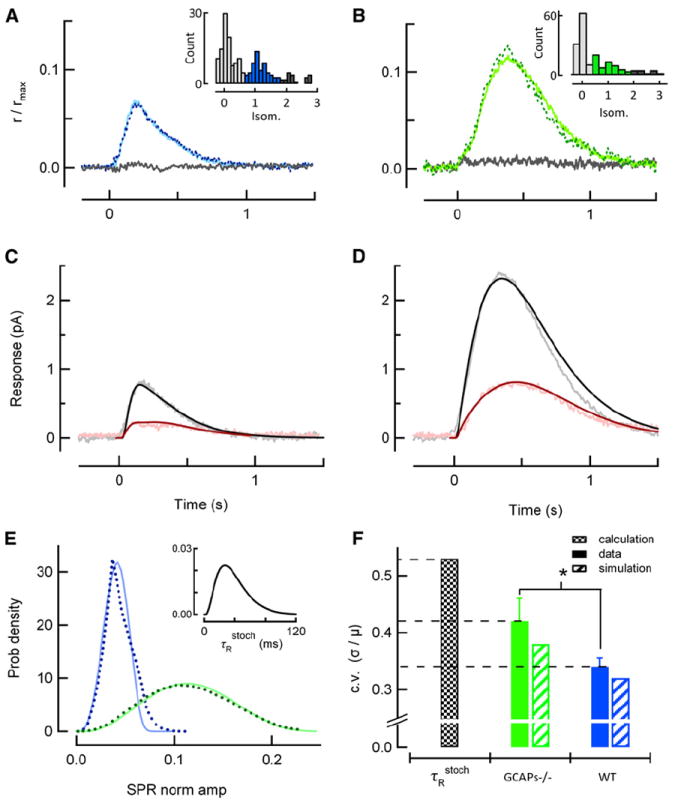
Rod photoreceptors generate amplified, reproducible responses to single photons via a G protein signaling cascade. Surprisingly, genetic perturbations that dramatically alter the deactivation of the principal signal amplifier, the GPCR rhodopsin (R∗), do not much alter the amplitude of single-photon responses (SPRs). These same perturbations, when crossed into a line lacking calcium feedback regulation of cGMP synthesis, produced much larger alterations in SPR amplitudes. Analysis of SPRs from rods with and without feedback reveal that the consequences of trial-to-trial fluctuations in R∗ lifetime in normal rods are also dampened by feedback regulation of cGMP synthesis. Thus, calcium feedback trumps the mechanisms of R∗ deactivation in determining the SPR amplitude, attenuating responses arising from longer R∗ lifetimes to a greater extent than those arising from shorter ones. As a result, rod SPRs achieve a more stereotyped amplitude, a characteristic considered important for reliable transmission through the visual system.


Figures

Figure 1
Figure 1. Saturating Flash Responses Reveal Perturbed R* Lifetimes
(A) Family of flash responses from a wild-type (WT) mouse rod showing the determination of the time in saturation (dashed line). Flashes ranged from 4 to 3,000 photons/μm2, corresponding to 1–630 R*/flash in this rod with collecting area of 0.21 μm2. Translational invariance of the falling phases reflects the same underlying rate processes as the flash strength increases. (B) The time that the response to a bright flash remains in saturation is plotted against the loge of the number of R* produced by the flash for WT (n = 8), Grk1S561L (n = 12), and Grk1+/− (n = 22) rods. Straight lines through the data have a slope of 200 ms, consistent with similar means of τD values measured individually in each rod (Table 1). The vertical displacements (ΔTsat) of the Grk1S561L and Grk1+/− lines from the WT line were −250 ms and +180 ms, respectively, and yield the values of the altered effective R* lifetimes (τReff) according to Equation 1. Error bars reflect S.E.M. (C) Population average SPRs of rods with effective R* lifetimes (τReff) that span a 5-fold range (WT, black, Table 1; Grk1+/−, blue, Table 1; Grk1S561L, orange, n = 11, ID = 14.8 ± 0.6) have peak amplitudes that span only a 2-fold range.
Figure 2
Figure 2. Depletion of Available PDE Molecules and Local Channel Saturation Do Not Explain Amplitude Stability for Long R* Lifetimes
(A) Simulated SPR of Grk1+/− rods (solid) superimposed upon the calculated number of G*-E* (dashed) produced as a function of time, assuming that R* activates G*-E* at a maximal rate of 300 s−1, with an effective lifetime τReff = 76 ms, and a G*-E* lifetime of 200 ms. (B) Spatial profile of cGMP concentration at three time points corresponding to the colored circles in (A). The fall in cGMP at the local site of photoisomerization is maximal at the SPR peak but does not exceed 18% of the dark cGMP concentration. Thus, local channel saturation contributes only slightly to the large degree of amplitude stability observed when R* lifetime is increased 2-fold beyond its WT level.
Figure 3
Figure 3. GCAPs-Mediated Feedback Stabilizes the SPR Amplitude against Genetic Perturbations of R* Lifetime
(A) Family of flash responses from a GCAPs−/− mouse rod showing the determination of the time in saturation (adapted from Gross et al., 2012). Flashes ranged from 4 to 1,800 photons/μm2, corresponding to 1–510 R*/flash in this rod with collecting area of 0.29 μm2. (B) The time that the response to a bright flash remains in saturation versus the natural log of the number of R* produced by the flash for wild-type (n = 8) Grk1S561L (n = 12), and Grk1+/− (n = 22) rods lacking GCAPs-mediated feedback (GCAPs−/− background), fitted by straight lines with a slope of 200 ms, consistent with the means of τD values measured individually in each rod (Table 1). The vertical displacements (ΔTsat) of the Grk1S561L and Grk1+/− lines from the WT line were −220 ms and +180 ms, respectively, consistent with measurements of τReff in the GCAPs+/+ background (Figure 1B). Error bars reflect S.E.M. (C) SPRs of rods lacking calcium feedback to cGMP synthesis via GCAPs (GCAPs−/−), but with identical changes in τReff, have substantially larger differences in peak amplitudes than the corresponding responses in the GCAPs+/+ background in Figure 1C.
Figure 4
Figure 4. A Spatiotemporal Model of Phototransduction Captures the Enhanced Amplitude Stability in the Presence of GCAPs-Mediated Feedback
(A) Simulated SPRs (thin traces) closely match the SPR (means +/− SEM, thick traces) experimentally determined from populations of wild-type (black/gray), Grk1+/− (blue), and Grk1S561L (orange) SPRs with feedback (A, GCAPs+/+ background) and without feedback (B, GCAPs−/− background). Parameters were optimized individually for each simulated response within 10% of the canonical values in Table 2. (C) Normalized mean SPR peak amplitudes (r/rmax at the time of the peak in A and B) are plotted against τReff for GCAPs+/+ and GCAPs−/− backgrounds (blue and green boxes, respectively). Mean steady state (s.s.) amplitudes of SPRs arising from R*s that do not deactivate are plotted for both genetic backgrounds (blue circle corresponds to SPR amplitude of Grk1−/− (Song et al., 2009 supplement); green circle corresponds to amplitude of GCAPs−/− “rogues” (Gross et al., 2012). Theoretical green and blue traces were simulated using the parameters in Table 2. Error bars reflect S.E.M. (error bars are smaller than the points in most cases). (D) GCAPs-mediated feedback more strongly attenuates SPRs arising from long-lived R*s. GCAPs+/+ and GCAPs−/− SPR amplitude data from (C) are plotted against each other (black squares; numbers indicate τReff), as are the corresponding theory traces (black trace). The dashed gray line is the relationship that would be expected if rods in GCAPs+/+ and GCAPs−/− backgrounds exhibited the same degree of stability. Error bars reflect S.E.M.
Figure 5
Figure 5. The Rate of cGMP Synthesis Increases More Rapidly for Longer R* Lifetimes, Constraining the Time to Peak and Conferring SPR Amplitude Stability
(A) Time course of the spatially integrated cGMP hydrolysis rate calculated for mean effective R* lifetimes of 15 ms (orange curve), 40 ms (black curve), and 76 ms (blue curve) with (solid traces) or without (gray dotted lines) GCAPs-mediated feedback. (B) Spatially integrated cGMP synthesis rates for the R* lifetimes listed in (A). Thin dotted black line indicates the constant (dark) rate of cGMP synthesis in the absence of GCAPs-mediated feedback. Note that the larger G*-E* activities in (A) correspond to steeper rates of change in the cGMP synthesis rates. (C) Spatially integrated rate of change of cGMP concentration (differences of the time courses in A and B). (D) Calculated influx of calcium through CNG channels and (E) calculated efflux of calcium via Na2+/Ca2+-K+ transporter for the same effective R* lifetimes of (A)–(C) in the presence of GCAPs-mediated feedback. (F) Time course of net calcium flux (differences of the time courses in D and E). In all panels, the solid curves transition to dashed curves at times corresponding to the peak of the SPRs. Shaded regions indicate distinct epochs during the SPR: Pink: cGMP synthesis remains near its dark level; green: rate of cGMP synthesis increases as a ramp with slope proportional to the constant cGMP hydrolysis rate, so that synthesis and hydrolysis cancel each other at the SPR peak; blue: SPR recovery phase.
Figure 6
Figure 6. Single-Photon Response Amplitude Is Less Reproducible in the Absence of GCAPs-Mediated Feedback
(A) Average of identified singletons in a representative WT rod, determined by histogram analysis of 200 dim flash trials (inset; identified singletons highlighted in blue, failures in light gray, amplitudes from multiple R* in dark gray). This average singleton (solid) closely resembles the average SPR determined independently in this rod by variance-to-mean analysis for the entire set of dim flashes (dotted). The gray trace is the average of the responses yielding failures in the histogram. (B) Same analysis as in (A), but from a representative GCAPs−/− rod in response to 188 repeated dim flashes. Solid green trace plots the average of the 63 identified singletons, corresponding to the green portion of the inset histogram, and closely resembles the average SPR determined independently by variance-to-mean analysis (dotted). (C and D) Population mean singleton response (gray) and time-dependent standard deviation (pink) calculated from five WT (C) and four GCAPs−/− (D) rods, with mean dark currents of 15.5 ± 1.4 and 16.1 ± 1.2 pA, respectively. The smooth curves are the mean (black) and time-dependent standard deviations (dark red) derived from model simulations of ensembles of SPRs for each genotype. (E) Probability distributions of calculated stochastic R* lifetimes (inset) and singleton amplitudes (dotted lines) determined from the simulation of 100,000 WT and GCAPs−/− SPRs using the stochastic R* deactivation scheme (Figure S2). Blue and green solid curves are probability density functions of singleton amplitudes predicted by transforming the τRstoch probability density by the theoretical stability curves in Figure 4C and reveal that the mechanisms that generate amplitude stability underlie reproducibility. (F) Filled bars indicate the experimentally determined c.v. of the GCAPs−/− (green) and WT (blue) singleton amplitudes calculated from rods whose averages are shown in (C) and (D) (asterisk denotes p = 0.02 in Student’s t test comparison). Black checked bar is the c.v. of the calculated τRstoch distribution shown in the inset in (E), and hatched bars indicate coefficients of variation of simulated singleton amplitude distributions shown in (E). Error bars reflect S.E.M.

Similar articles

Cited by

References

    1. Baylor DA, Lamb TD, Yau KW. Responses of retinal rods to single photons. J Physiol. 1979;288:613–634. - PMC - PubMed
    1. Baylor DA, Nunn BJ, Schnapf JL. The photocurrent, noise and spectral sensitivity of rods of the monkey Macaca fascicularis. J Physiol. 1984;357:575–607. - PMC - PubMed
    1. Bisegna P, Caruso G, Andreucci D, Shen L, Gurevich VV, Hamm HE, DiBenedetto E. Diffusion of the second messengers in the cytoplasm acts as a variability suppressor of the single photon response in vertebrate phototransduction. Biophys J. 2008;94:3363–3383. - PMC - PubMed
    1. Burns ME, Pugh EN., Jr Lessons from photoreceptors: turning off g-protein signaling in living cells. Physiology (Bethesda) 2010;25:72–84. - PMC - PubMed
    1. Burns ME, Mendez A, Chen J, Baylor DA. Dynamics of cyclic GMP synthesis in retinal rods. Neuron. 2002;36:81–91. - PubMed

Publication types

MeSH terms