. 2012 Oct 26;151(3):559-75.
doi: 10.1016/j.cell.2012.09.032. Epub 2012 Oct 18.

Efficient direct reprogramming of mature amniotic cells into endothelial cells by ETS factors and TGFβ suppression

Affiliations

Efficient direct reprogramming of mature amniotic cells into endothelial cells by ETS factors and TGFβ suppression

Michael Ginsberg et al. Cell. .

Abstract

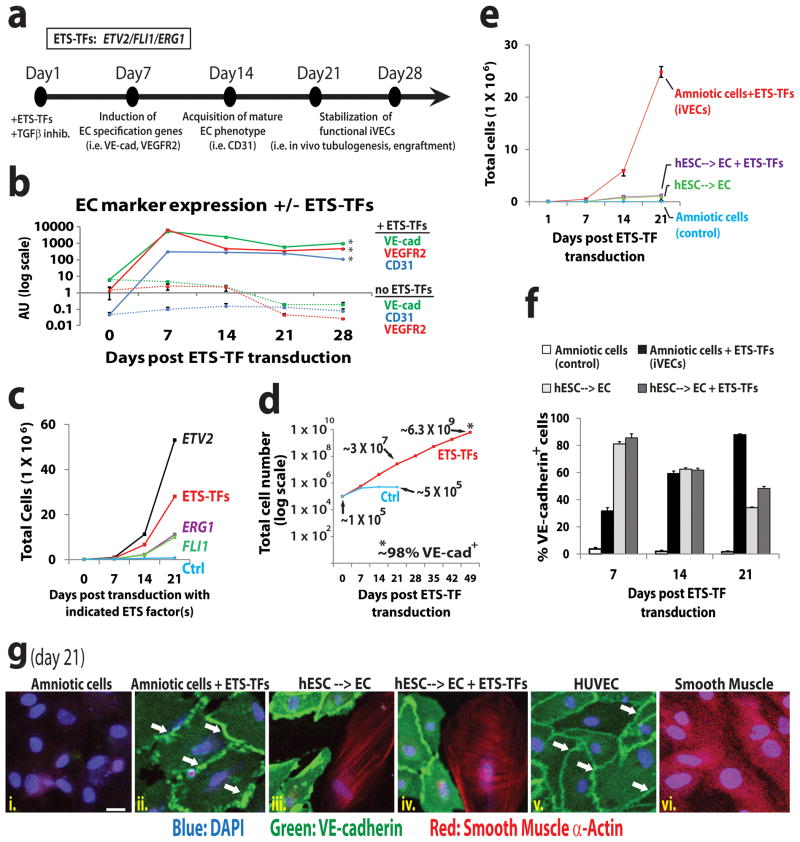
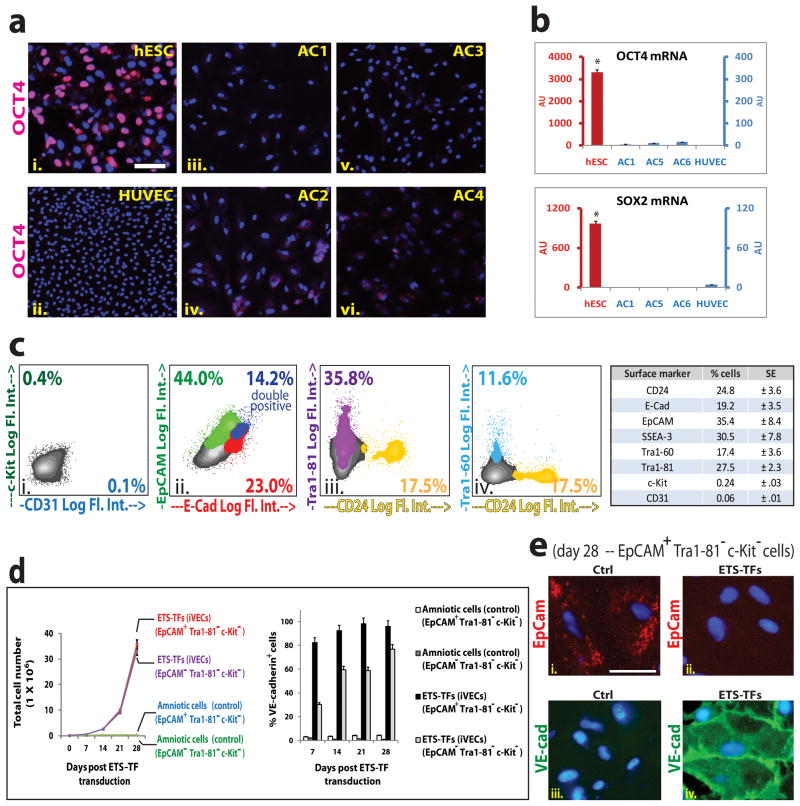
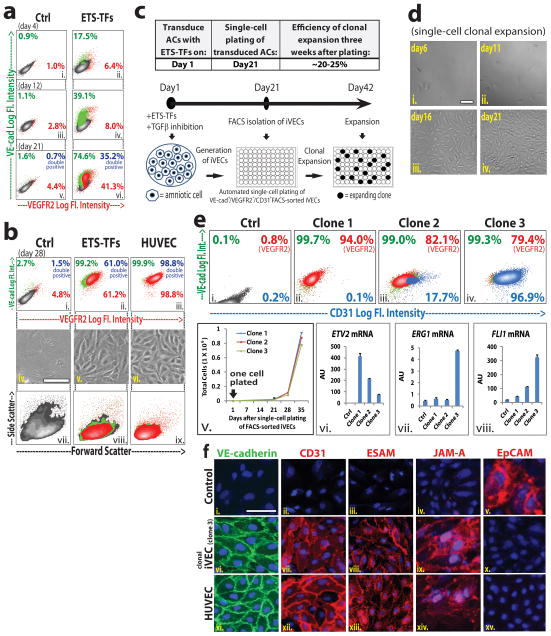
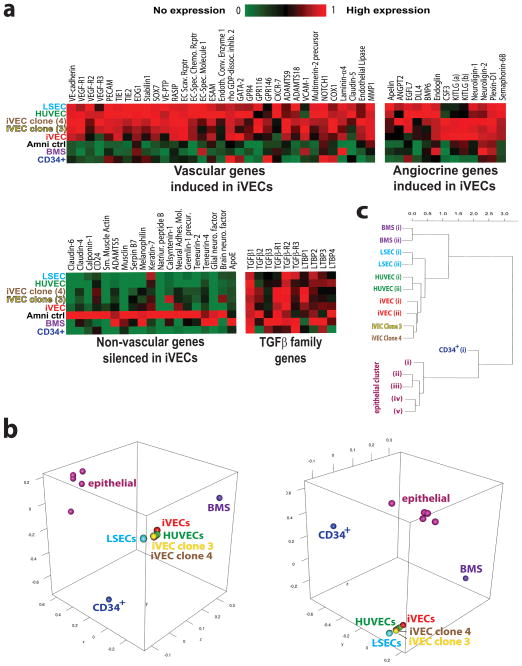
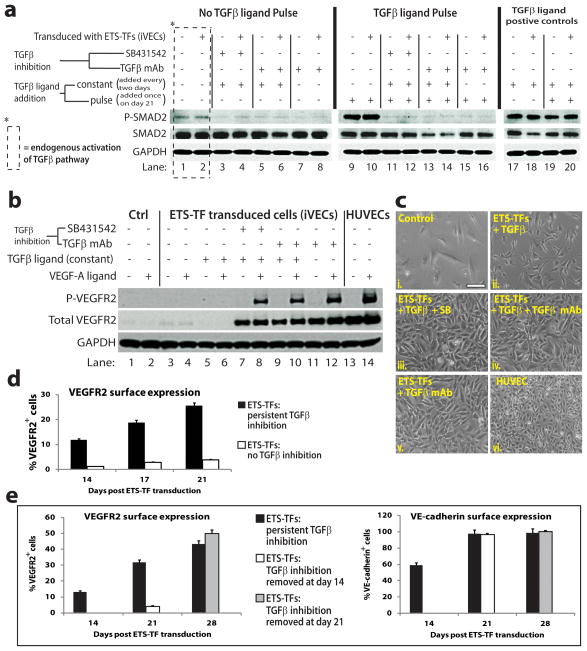
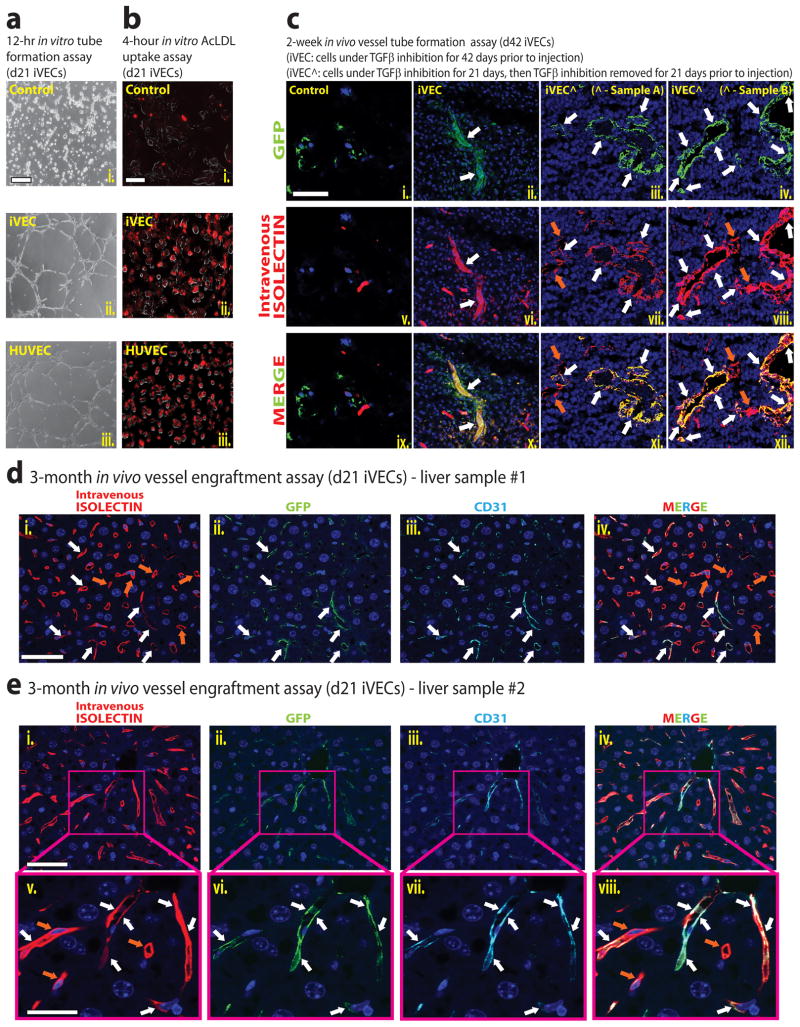
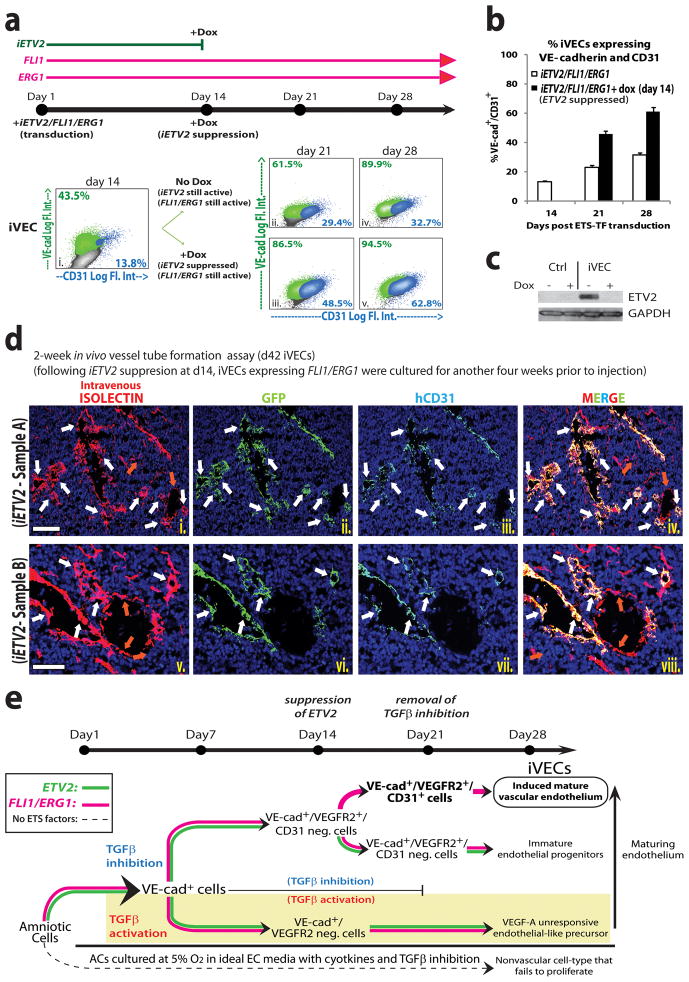
ETS transcription factors ETV2, FLI1, and ERG1 specify pluripotent stem cells into induced vascular endothelial cells (iVECs). However, iVECs are unstable and drift toward nonvascular cells. We show that human midgestation c-Kit(-) lineage-committed amniotic cells (ACs) can be reprogrammed into vascular endothelial cells (rAC-VECs) without transitioning through a pluripotent state. Transient ETV2 expression in ACs generates immature rAC-VECs, whereas coexpression with FLI1/ERG1 endows rAC-VECs with a vascular repertoire and morphology matching mature endothelial cells (ECs). Brief TGFβ-inhibition functionalizes VEGFR2 signaling, augmenting specification of ACs into rAC-VECs. Genome-wide transcriptional analyses showed that rAC-VECs are similar to adult ECs in which vascular-specific genes are expressed and nonvascular genes are silenced. Functionally, rAC-VECs form stable vasculature in Matrigel plugs and regenerating livers. Therefore, short-term ETV2 expression and TGFβ inhibition with constitutive ERG1/FLI1 coexpression reprogram mature ACs into durable rAC-VECs with clinical-scale expansion potential. Banking of HLA-typed rAC-VECs establishes a vascular inventory for treatment of diverse disorders.


Figures

Figure 1
Figure 1. ACs transduced with ETS-TFs and TGFβ inhibition display a proliferative and stable vascular phenotype
a) Schematic of iVEC reprogramming platform. ETV2, FLI1 and ERG1 (ETS-TFs) transduced ACs were cultured in the presence of TGFβ inhibitor (SB431542 – 5μM) and assayed for expression of EC markers. b) EC marker expression was measured in ACs transduced with lentiviral vectors encoding ETV2, ERG1, and FLI1 plus TGFβ inhibition. [“+” = cells transduced with ETV2, ERG1, and FLI1 lentivirus; “−” = cells transduced with equivalent doses of empty-vector lentivirus. All subsequent control (‘ctrl’) samples in this report were transduced with empty-vector virus unless otherwise noted]. (Triplicate samples: *p<.01 compared to control ACs for day 7 – day 28). c) Cellular expansion of ACs transduced with ETV2, FLI1 and/or ERG1 plus TGFβ inhibition for 3 weeks (n=3, p<0.05 for all conditions). d) Cellular expansion of ACs transduced with ETS-TFs plus TGFβ inhibition for 7 weeks (n=4 independent experiments). Fluorescence-activated cell sorting (FACS) performed at week 7 reveals nearly 100% of these cells express VE-cadherin (VE-cad). e) Cellular expansion of ACs and hESC-derived ECs transduced with ETS-TFs plus TGFβ inhibition for 3 weeks (n=3, p<0.05). f) FACS reveals % of VE-cadherin+ cells following transduction by ETS-TFs. g) Immunofluorescence micrographs stained with antibodies to VE-cadherin and Smooth Muscle α-Actin are shown for ETS-TF transduced ACs (iVECs) and ETS-TF transduced hESC-derived VE-cadherin+CD31+VEGFR2+ ECs plus TGFβ inhibition for 3 weeks. HUVECs and smooth muscle cells serve as controls. VE-cadherin (green stain), Smooth Muscle α-Actin (red stain), DAPI (blue stain), white arrows indicate junctional staining of VE-cadherin. Scale bar – 25 μm. See also Sup Figures S1 and S2.
Figure 2
Figure 2. Lineage-committed mature epithelioid and mesenchymal/fibroblastic (Tra1-81 c-Kit) ACs are reprogrammable into iVECs
a) hESCs(i.), HUVECs (ii.), and ACs (AC1 to AC4: iii.–vi.) were stained for OCT4 protein (pink). DAPI (blue). Scale bar – 100 μm. b) OCT4 (upper graph) and SOX2 (lower graph) mRNA expression was measured in hESCs, HUVECs, and ACs (AC1, AC5, AC6). Red bars: hESC data (y-axis scale, left side of graph). Blue bars: AC and HUVEC data (y-axis scale, right side of graph). (OCT4 and SOX2: *p<.002 compared to ACs and to HUVECs). c) FACS of ACs indicate presence of lineage-committed and uncommitted cells. One representative cell-line is depicted (i.–iv.). Specific markers tested are indicated on ‘x’ and ‘y’ axes as Log fluorescent intensity, (Log. Fl. Int.) showing the percentage of cells positive for that marker. Chart (right panel) displays mean values for percentage of cells expressing designated markers across fifteen independent cultured AC samples (SE: Standard Error). d) (left graph) Cellular expansion of ETS-TF transduced EpCAM+Tra1-81 c-Kit and EpCAM Tra1-81 c-Kit ACs plus TGFβ inhibition for 4 weeks. (Right graph) FACS reveals % of VE-cadherin+ cells following transduction with ETS-TFs (n=3, P<0.05). e) Immunofluorescence micrographs are shown for ETS-TF transduced EpCAM+Tra1-81c-Kit ACs in the presence of TGFβ inhibition for 4 weeks. EpCAM (red stain), VE-cad (green stain), DAPI (blue stain). Scale bar – 25 μm. See also Sup Figure S3.
Figure 3
Figure 3. Optimal stoichiometric ratios of ETV2, ERG1, and FLI1 are essential for generation of clonal mature iVECs
FACS reveals VE-cad and VEGFR2 expression on emerging iVECs at 4 days (a: i.– ii.), 12 days (a: iii.– iv.), 21 days (a: v.– vi.), and 28 days (b: i.–ii.) following transduction with ETS-TFs plus TGFβ inhibition. (control ECs: HUVECs - b: iii.). The morphology (b: iv. – vi.) and size (b: vii. – ix.) of emerging iVECs approximated those of control ECs. Scale bar – 50 μm. c) Schematic of single-cell clonal expansion protocol: ACs were transduced with ETS-TFs and cultured in the presence of TGFβ inhibition. At day 21, monoclonal antibodies (mAb) were used to isolate VE-cad+VEGFR2+CD31+ cells. These iVECs then underwent automated single-cell plating into a 96-well format for clonal expansion for several weeks. On average, 20 to 25% of individual plated cells formed colonies. d) Single-cell clonal expansion over three weeks following VE-cad+VEGFR2+CD31+ isolation (day 21 through day 42). Scale bar – 100 μm. e) FACS of specific iVEC Clone-1, Clone-2, and Clone-3 (boxes ii.– iv.) reveals VE-cad, VEGFR2 and CD31 surface expression at day 42 of clonal expansion protocol (i.e. 3 weeks post VE-cad+VEGFR2+CD31+ isolation). Cellular expansion of iVEC clones from time of single-cell plating (‘day 21’ of clonal expansion protocol) over subsequent 5 weeks (box v.). Expression levels for ETV2, FLI1, and ERG1 of iVEC clones at day 42 of clonal expansion protocol (boxes vi. – viii.). f) Immunofluorescence micrographs are shown for control (ctrl) ACs, clonal iVECs (Clone-3 – day 42) and HUVECs. VE-cad (green stain: i.,vi.,xi.), CD31 (red stain: ii.,vii.,xii.), ESAM (red stain: iii.,viii.,xiii.), JAM-A (red stain: iv.,ix.,xiv.), EpCAM (red stain: v.,x.,xv.), DAPI (blue stain). Scale bar – 50 μm. See also Sup Figure S4 and S5.
Figure 4
Figure 4. iVEC global gene transcriptome reveals vascular genes are turned on while non-vascular genes are silenced, matching expression profile of mature ECs
a) ETS-TF transduced ACs (‘iVEC’) as well as two iVEC clones (‘iVEC Clone-3’ and ‘iVEC Clone-4’) cultured for two months with TGFβ inhibition underwent RNA-seq analysis. (iVEC Clone-4 has a similar ETS-TF expression profile to that of iVEC Clone-3 – data not shown). The expression profile of these iVEC samples were compared to human umbilical cord-blood derived CD34+ cells (‘CD34+’), human bone marrow stromal cells (‘BMS’), naïve human ACs (‘Amni ctrl’), ‘HUVEC’ and ‘LSEC’. Heat-maps of relative transcription levels are shown. b) Three dimensional MDS plots (3D MDS) was generated based on all pairwise distances between the global transcriptome-wide RNA-seq profiles of the samples shown here, including adult lung airway epithelial cells (Hackett et al., 2012). Distances were defined as one minus the Pearson correlation between two profiles. Multidimensional scaling (MDS) was used to identify the set of points in 3D space such that the distances between the points are approximately equal to the true distances between samples. This analysis shows a tight colocalization of clonal and nonconal iVECs with HUVECs and LSECs, thus indicating that their genome-wide expression profiles are highly similar. Contrarily, non-vascular cell types, such as BMS, epithelial cells, and CD34+ hematopoietic cells manifest no similarities to iVECs. This analysis was not biased towards any gene set or processes: all >30,000 RefSeq transcripts whose expression was quantified by RNA-seq were used to calculate distances between samples. c) Hierarchical clustering of iVEC and non-iVEC samples. The same samples and pairwise distances between global transcriptome-wide RNA-seq profiles were used as those used for 3D-MDS, by performing average linkage clustering. Like the 3D-MDS analysis, hierarchical clustering shows that clonal and non-clonal iVECs, but not non-vascular cells cluster closely with HUVECs and LSECs. See also 3D-MDS Movie.
Figure 5
Figure 5. TGFβ inhibition upregulates and confers functionality to VEGFR2 in iVECs
a) Western blot analysis of day 21 iVECs that were treated with or without TGFβ ligand neutralizing mAB (TGFβ ligand mAb, directed against β1, β2, and β3) or TGFβ inhibition. This experiment was performed ± TGFβ ligands (TGFβ1 and TGFβ3) to delineate the extent of TGFβ receptor activity. ETS-TF transduced ACs were incubated ± TGFβ ligands (10ng/ml) every two days (‘constant’) with or without TGFβ ligand mAb (10 μg/ml) or TGFβ inhibitor. On day 21, ETS-TF transduced ACs were serum-starved for 4 hours, and then treated ± one dose of TGFβ ligands (10ng/ml) for 45 minutes (‘pulse’) with or without TGFβ ligand mAb or TGFβ inhibitor. Following day 21 treatment, all cells were assayed for phosphorylated SMAD2 (P-SMAD2), total SMAD2, and GAPDH. b) Western blot analysis of day 21 iVECs that were treated ± ‘constant’ TGFβ ligands, with or without TGFβ ligand mAb or TGFβ inhibitor. On day 21, ETS-TF transduced ACs were serum-starved for 4 hours, and then treated ± VEGF-A (50ng/ml) for 5 minutes. Following day 21 treatment, cells were assayed for phosphorylated VEGFR2 (P-VEGFR2), total VEGFR2, and GAPDH. c) Cell morphology of control ACs (i.), ETS-TF transduced ACs (ii.–v.) and HUVECs (vi.) was noted for indicated treatments with TGFβ ligands, TGFβ ligand mAb, and/or TGFβ small molecule inhibitor. Scale bar – 100 μm. d) FACS reveals expression of VEGFR2 in day 21 ETS-TF transduced ACs in the presence (black bars) or absence (white bars) of persistent TGFβ inhibition. e) FACS reveals surface expression of VEGFR2 (left graph) and VE-cad (right graph) in day 28 ETS-TF transduced ACs. Black bars: cells subjected to persistent TGFβ inhibition – EC marker expression was assessed on day 14, day 21, and day 28. White bars: cells subjected to TGFβ inhibition for 14 days – EC marker expression was assessed on day 21. Gray bars: cells subjected to TGFβ inhibition for 21 days – EC marker expression was assessed on day 28.
Figure 6
Figure 6. iVECs establish functionally perfused vessels in vitro and in vivo
a) In vitro tube formation assay of control ACs, day 21 iVECs, and HUVECs cultured on Matrigel in EM + TGFβ inhibition for 12 hours. Phase-contrast microscopy images of different groups are shown. Scale bar – 100μm. b) Control ACs, day 21 iVECs, and HUVECs were treated with labeled Ac-LDL (DiI label) for 4 hours. Scale bar – 100μm. c) In vivo tube formation assay of GFP-labeled control ACs (i., v., ix.), GFP-labeled day 42 iVECs (ii., vi., x.), and GFP-labeled day 42 iVECs in which TGFβ inhibition was removed at day 21 (Sample A - iii., vii., xi.; Sample B - iv., viii., xii.). Cells were loaded separately into Matrigel plugs and implanted subcutaneously into NSG mice. Two weeks after implantation, mice were intravenously perfused with Alexa568-Isolectin-B4. After 10 minutes plugs were removed and sectioned. Immunofluorescence show control ACs and iVECs in green (GFP), intravital labeling of perfused vasculature in red (Isolectin), and nuclear counterstain (DAPI) in blue. Scale bar – 50μm. White arrows indicate the colocalization of GFP- and isolectin-marked (anastomosed) vessels. Orange arrows indicate only isolectin-marked host mouse vessels. d) and e) In vivo engraftment of day 21 iVECs (GFP-labeled) into liver sinusoidal vessels of two mice. After performing 70% partial hepatectomy on NSG mice, 5×10⁵ GFP-labeled day 21 iVECs were transplanted via intrasplenic route, which will drain into portal circulation and incorporate into liver vasculature. Thirty minutes later, the spleen was removed to prevent migration back to spleen. Three months following transplantation, the mice were perfused with Alexa568-Isolectin-B4 and the liver was removed. Immunofluorescence show control iVECs in green (GFP), intravital labeling of perfused vasculature in red (Isolectin), human CD31 staining in cyan, and nuclear counterstain (DAPI) in blue. Liver sample #1 (d) was imaged at low magnification (i. – iv.: scale bar - 50 μm). Liver sample #2 (e) was imaged at low (i. – iv.: scale bar - 50 μm) and high magnification (v. – viii.: scale bar - 25 μm). White arrows indicate the colocalization of GFP-, CD31- and isolectin-marked (anastomosed) vessels. Orange arrows indicate only isolectin-marked host mouse vessels.
Figure 7
Figure 7. Transient ETV2 and constitutive FLI1 and ERG1 expression, concomitant with TGFβ inhibition, generate long-lasting iVECs without loss of vascular identity
a) FACS reveals expression of VE-cad and CD31 in ACs transduced with iETV2/FLI1/ERG1 for 14 (i.), 21 (ii.– iii.), and 28 (iv.– v.) days plus TGFβ inhibition. (‘iETV2’: inducible ETV2 lentivirus). A subset of these cells (iii. and v.) was treated with doxycycline (Dox) at day 14 to suppress ETV2 protein. b) Percentage of VE-cad+CD31+ cells is shown. White bars: no Dox treatment. Black bars: Dox treatment at day 14. c) iETV2 suppression by Dox was confirmed by Western blot analysis. d) In vivo tube formation assay of GFP-labeled day 42 iVECs in which iETV2 expression was suppressed at day 14. iVECs were subjected to Matrigel plug analysis in NSG mice as previously described in figure 6c. Immunofluorescence micrographs show iVECs in green (GFP), intravital labeling of perfused vasculature in red (Isolectin), human CD31 staining in cyan, and nuclear counterstain (DAPI) in blue. Sample A was imaged at low magnification (i. – iv.: scale bar - 100 μm). Sample B was imaged at high magnification (v. – viii.: scale bar - 50 μm). White arrows indicate the colocalization of GFP-, CD31- and isolectin-marked (anastomosed) vessels. Orange arrows indicate only isolectin-marked host mouse vessels. e) Modular ETS-TF mediated reprogramming of ACs into abundant mature iVECs. Even when cultured in ‘optimal EC conditions’, untransduced ACs do not reprogram into iVECs, nor do they proliferate (bottom panel). In the absence of TGFβ inhibition, ETS-TF transduced ACs are VE-cad+, but fail to express other essential EC-markers, including functional VEGFR2, resulting in the generation of ‘VEGF-A unresponsive’ EC-like precursors (shaded panel). Transient inhibition of TGFβ signaling for approximately 3 weeks upregulates and functionalizes VEGFR2, allowing for VEGF-A dependent signaling events to proceed (upper panel). Co-expression of FLI1/ERG1 with ETV2 along with TGFβ inhibition maintains VE-cadherin and VEGFR2 expression; however constitutive ETV2 inhibits CD31+ expression, resulting in the production of immature EC progenitors (upper panel - low). Upon suppression of ETV2 at day 14, CD31 is induced, facilitating the generation of mature iVECs (upper panel - high). Thus, modular TGFβ inhibition and ETV2 expression along with constitutive FLI1/ERG1 co-expression provide for an efficient approach to reprogram lineage-committed ACs into long-lasting functional iVECs. See also Sup Figure S6 and S7.

Similar articles

Cited by

References

    1. Asano Y, Stawski L, Hant F, Highland K, Silver R, Szalai G, Watson DK, Trojanowska M. Endothelial FLI1 deficiency impairs vascular homeostasis: a role in scleroderma vasculopathy. Am J Pathol. 2010;176:1983–1998. - PMC - PubMed
    1. Asano Y, Trojanowska M. Phosphorylation of FLI1 at threonine 312 by protein kinase C delta promotes its interaction with p300/CREB-binding protein-associated factor and subsequent acetylation in response to transforming growth factor beta. Mol Cell Biol. 2009;29:1882–1894. - PMC - PubMed
    1. Benavides OM, Petsche JJ, Moise KJ, Jr, Johnson A, Jacot JG. Evaluation of Endothelial Cells Differentiated from Amniotic Fluid-Derived Stem Cells. Tissue Eng Part A 2012 - PMC - PubMed
    1. Birdsey GM, Dryden NH, Amsellem V, Gebhardt F, Sahnan K, Haskard DO, Dejana E, Mason JC, Randi AM. Transcription factor Erg regulates angiogenesis and endothelial apoptosis through VE-cadherin. Blood. 2008;111:3498–3506. - PMC - PubMed
    1. Bossolasco P, Montemurro T, Cova L, Zangrossi S, Calzarossa C, Buiatiotis S, Soligo D, Bosari S, Silani V, Deliliers GL, et al. Molecular and phenotypic characterization of human amniotic fluid cells and their differentiation potential. Cell Res. 2006;16:329–336. - PubMed

Publication types

MeSH terms

Substances