

Long-timescale dynamics and regulation of Sec-facilitated protein translocation
- PMID: 23084746
- PMCID: PMC3483636
- DOI: 10.1016/j.celrep.2012.08.039
Long-timescale dynamics and regulation of Sec-facilitated protein translocation
Abstract
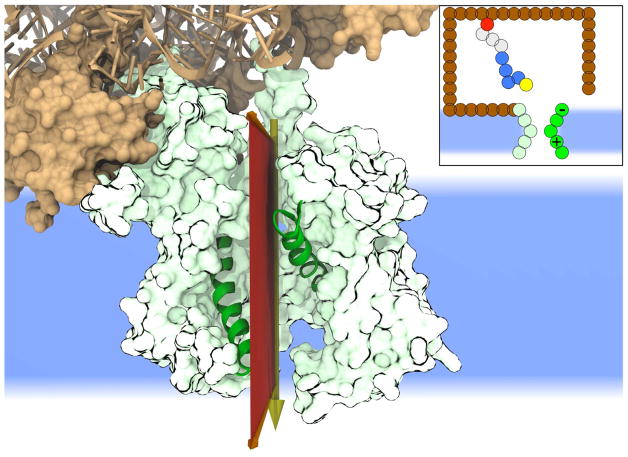
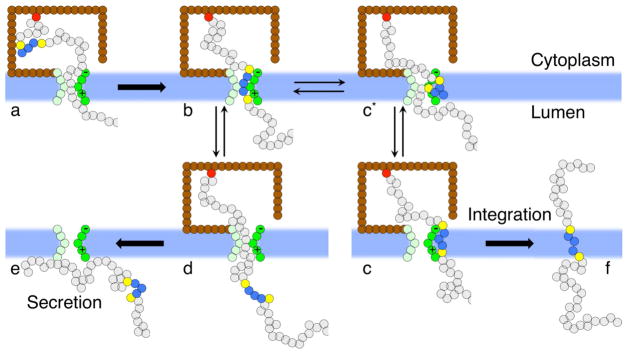
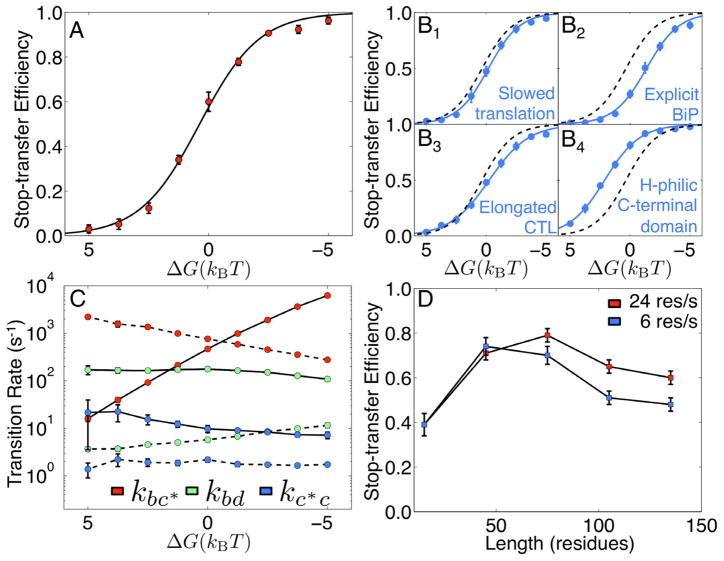
We present a coarse-grained modeling approach that spans the nanosecond- to minute-timescale dynamics of cotranslational protein translocation. The method enables direct simulation of both integral membrane protein topogenesis and transmembrane domain (TM) stop-transfer efficiency. Simulations reveal multiple kinetic pathways for protein integration, including a mechanism in which the nascent protein undergoes slow-timescale reorientation, or flipping, in the confined environment of the translocon channel. Competition among these pathways gives rise to the experimentally observed dependence of protein topology on ribosomal translation rate and protein length. We further demonstrate that sigmoidal dependence of stop-transfer efficiency on TM hydrophobicity arises from local equilibration of the TM across the translocon lateral gate, and it is predicted that slowing ribosomal translation yields decreased stop-transfer efficiency in long proteins. This work reveals the balance between equilibrium and nonequilibrium processes in protein targeting, and it provides insight into the molecular regulation of the Sec translocon.
Copyright © 2012 The Authors. Published by Elsevier Inc. All rights reserved.
Figures


Similar articles
-
Direct simulation of early-stage Sec-facilitated protein translocation.J Am Chem Soc. 2012 Aug 22;134(33):13700-7. doi: 10.1021/ja3034526. Epub 2012 Aug 10. J Am Chem Soc. 2012. PMID: 22852862 Free PMC article.
-
Hydrophobically stabilized open state for the lateral gate of the Sec translocon.Proc Natl Acad Sci U S A. 2010 Mar 23;107(12):5399-404. doi: 10.1073/pnas.0914752107. Epub 2010 Mar 4. Proc Natl Acad Sci U S A. 2010. PMID: 20203009 Free PMC article.
-
Structurally detailed coarse-grained model for Sec-facilitated co-translational protein translocation and membrane integration.PLoS Comput Biol. 2017 Mar 22;13(3):e1005427. doi: 10.1371/journal.pcbi.1005427. eCollection 2017 Mar. PLoS Comput Biol. 2017. PMID: 28328943 Free PMC article.
-
Dynamics of Co-translational Membrane Protein Integration and Translocation via the Sec Translocon.J Am Chem Soc. 2020 Mar 25;142(12):5449-5460. doi: 10.1021/jacs.9b07820. Epub 2020 Mar 13. J Am Chem Soc. 2020. PMID: 32130863 Free PMC article. Review.
-
Structural and Mechanistic Insights into Protein Translocation.Annu Rev Cell Dev Biol. 2017 Oct 6;33:369-390. doi: 10.1146/annurev-cellbio-100616-060439. Epub 2017 May 31. Annu Rev Cell Dev Biol. 2017. PMID: 28564553 Review.
Cited by
-
The signal peptide plus a cluster of positive charges in prion protein dictate chaperone-mediated Sec61 channel gating.Biol Open. 2019 Mar 5;8(3):bio040691. doi: 10.1242/bio.040691. Biol Open. 2019. PMID: 30745438 Free PMC article.
-
Exploring the nature of the translocon-assisted protein insertion.Proc Natl Acad Sci U S A. 2013 Jan 8;110(2):495-500. doi: 10.1073/pnas.1220361110. Epub 2012 Dec 26. Proc Natl Acad Sci U S A. 2013. PMID: 23269832 Free PMC article.
-
An effective coarse-grained model for biological simulations: recent refinements and validations.Proteins. 2014 Jul;82(7):1168-85. doi: 10.1002/prot.24482. Proteins. 2014. PMID: 25050439 Free PMC article.
-
Allosteric response and substrate sensitivity in peptide binding of the signal recognition particle.J Biol Chem. 2014 Oct 31;289(44):30868-30879. doi: 10.1074/jbc.M114.584912. Epub 2014 Sep 18. J Biol Chem. 2014. PMID: 25237192 Free PMC article.
-
The messy process of guiding proteins into membranes.Elife. 2015 Nov 6;4:e12100. doi: 10.7554/eLife.12100. Elife. 2015. PMID: 26544679 Free PMC article.
References
-
- Beckmann R, Spahn CM, Eswar N, Helmers J, Penczek PA, Sali A, Frank J, Blobel G. Architecture of the protein-conducting channel associated with the translating 80S ribosome. Cell. 2001;107:361–372. - PubMed
-
- Beltzer JP, Fiedler K, Fuhrer C, Geffen I, Handschin C, Wessels HP, Spiess M. Charged residues are major determinants of the transmembrane orientation of a signal-anchor sequence. J Biol Chem. 1991;266:973–978. - PubMed
-
- Berg Bvd, Clemons WM, Collinson I, Modis Y, Hartmann E, Harrison SC, Rapoport TA. X-ray structure of a protein-conducting channel. Nature. 2004;427:36–44. - PubMed
-
- Bieker KL, Silhavy TJ. PrlA (SecY) and PrlG (SecE) interact directly and function sequentially during protein translocation in E. coli. Cell. 1990;61:833–842. - PubMed
Publication types
MeSH terms
Substances
Grants and funding
LinkOut - more resources
Full Text Sources
Other Literature Sources
