. 2012 Oct 25;2(4):1048-60.
doi: 10.1016/j.celrep.2012.09.014. Epub 2012 Oct 19.

An in vivo functional screen uncovers miR-150-mediated regulation of hematopoietic injury response

Affiliations

An in vivo functional screen uncovers miR-150-mediated regulation of hematopoietic injury response

Brian D Adams et al. Cell Rep. .

Abstract

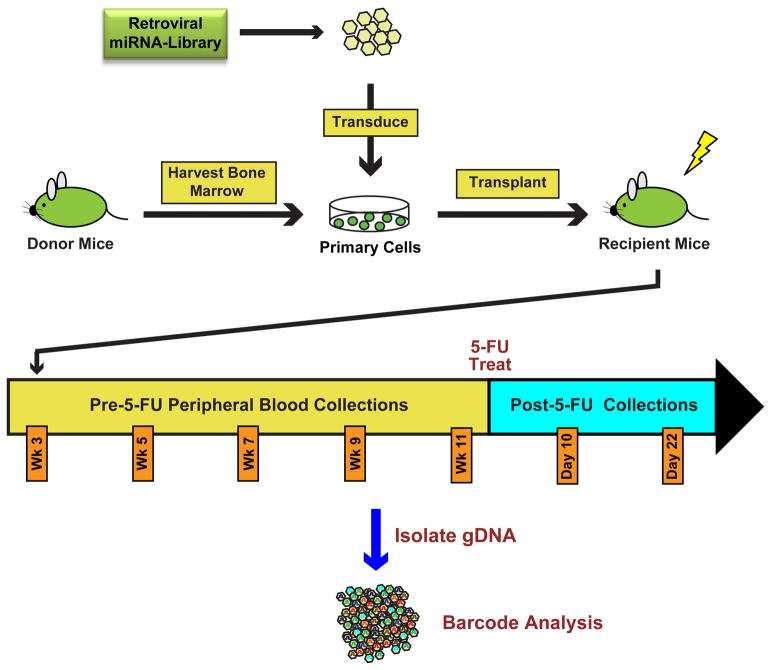
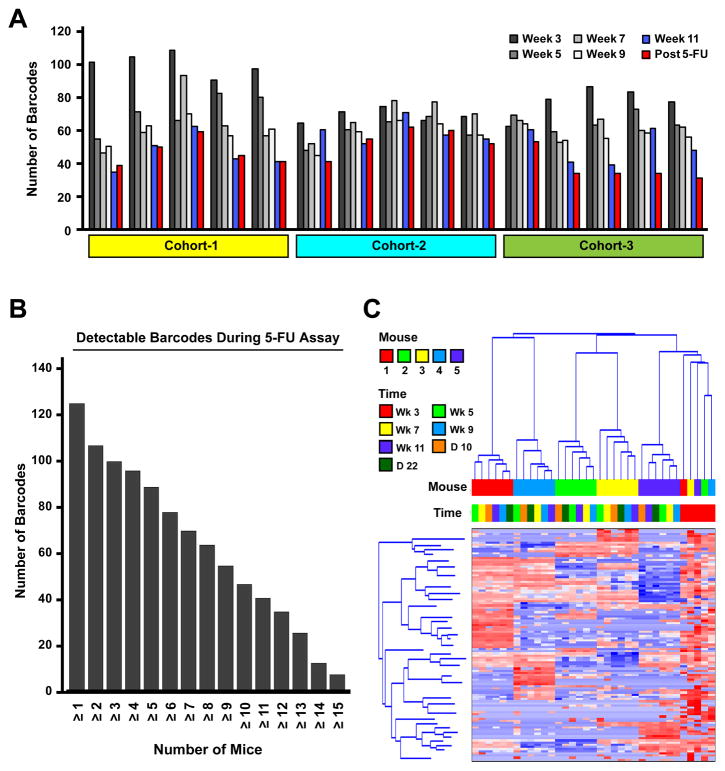
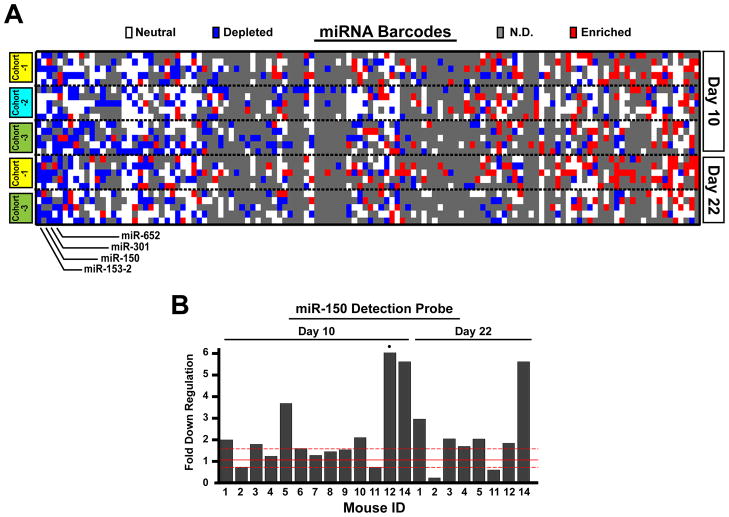
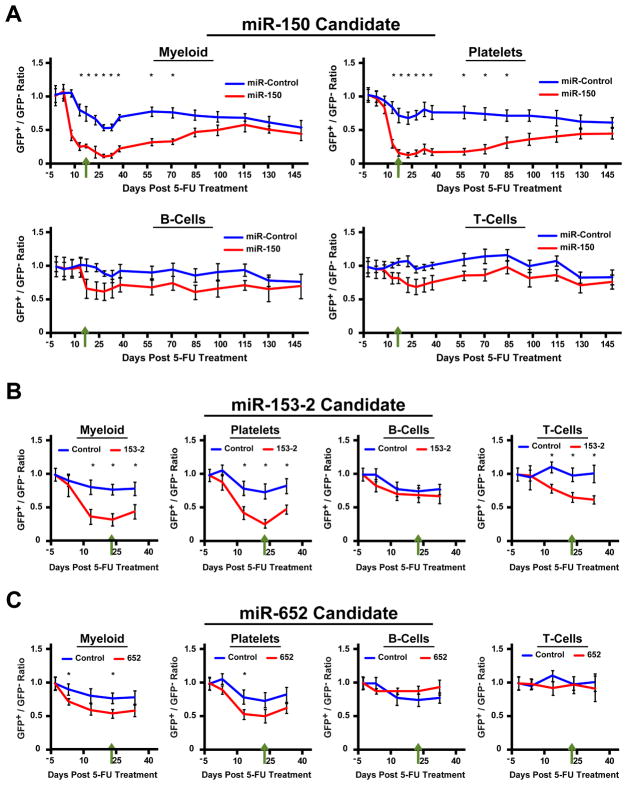
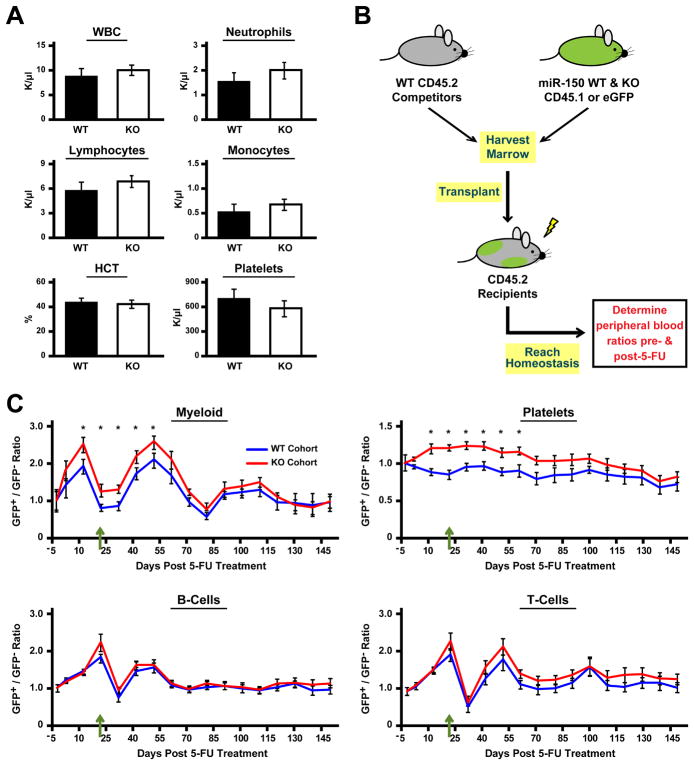
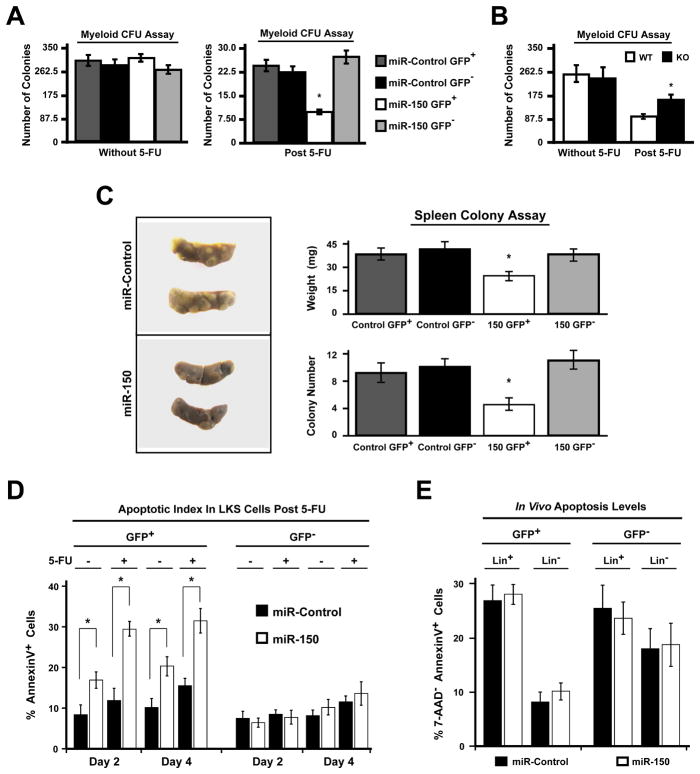
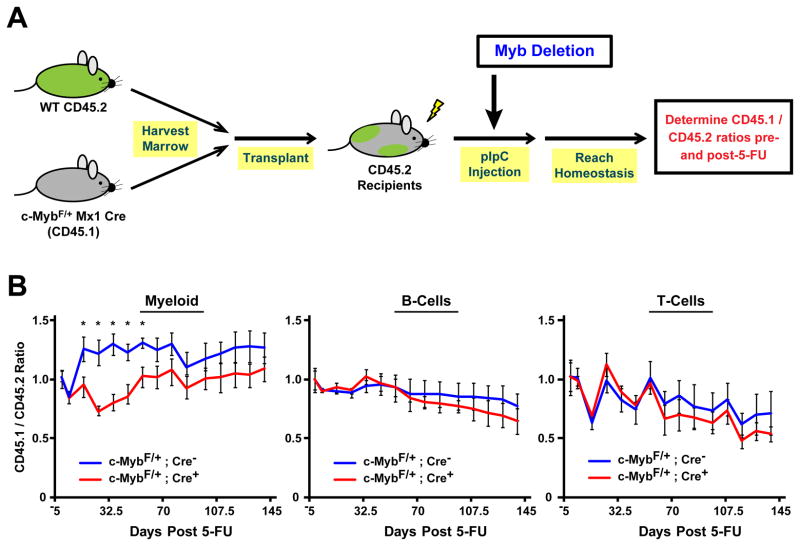
Hematopoietic stem and progenitor cells are often undesired targets of chemotherapies, leading to hematopoietic suppression requiring careful clinical management. Whether microRNAs control hematopoietic injury response is largely unknown. We report an in vivo gain-of-function screen and the identification of miR-150 as an inhibitor of hematopoietic recovery upon 5-fluorouracil-induced injury. Utilizing a bone marrow transplant model with a barcoded microRNA library, we screened for barcode abundance in peripheral blood of recipient mice before and after 5-fluorouracil treatment. Overexpression of screen-candidate miR-150 resulted in significantly slowed recovery rates across major blood lineages, with associated impairment of bone marrow clonogenic potential. Conversely, platelets and myeloid cells from miR-150 null marrow recovered faster after 5-fluorouracil treatment. Heterozygous knockout of c-myb, a conserved target of miR-150, partially phenocopied miR-150-forced expression. Our data highlight the role of microRNAs in controlling hematopoietic injury response and demonstrate the power of in vivo functional screens for studying microRNAs in normal tissue physiology.


Figures

Figure 1
Figure 1. Schematic of the in vivo miRNA screen “Related to Figure S1, Table S2, and Table S5”
Donor bone marrow cells were transduced with a pooled miRNA expression library and transplanted into lethally irradiated recipient mice. Peripheral blood samples were collected at indicated weeks (wk) post-transplantation. Mice were challenged with 5-FU 3 days after the week 11 collection, and sampled at indicated days post 5-FU. Genomic DNA (gDNA) was isolated from peripheral blood and subjected to barcode analysis.
Figure 2
Figure 2. Barcode analysis from the in vivo screen “Related to Figure S2, and Table S5”
(A) Barcodes were measured from red-cell-lysed peripheral blood samples (effectively from all nucleated cells). The numbers of barcodes detected in each mouse at different time points are shown. Data were grouped by individual mice, from a total of 3 independent cohorts of 15 mice. (B) The numbers of unique barcodes detected in the screen cohort are shown for week 11 post-transplantation and day 10 post-5-FU. Data represent the number of barcodes that can be detected in at least the specified number of mice. (C) Unsupervised clustering of barcode intensity primarily groups samples by recipient mice. A representative heatmap is shown, in which log2-transformed data from samples collected at indicated weeks (wk) post-transplantation and days (D) post-5-FU were analyzed. Blue indicates lower signal, whereas red indicates higher signal.
Figure 3
Figure 3. In vivo screen identifies candidate miRNAs that inhibit hematopoietic recovery
“Related to Figure S3 and Table S5” (A) A representative heatmap for consistency score evaluation of the screen. Comparisons between Day 10 & 22 post-5-FU time-points to Week 11 were calculated for each mouse (data in rows) and each miRNA barcode (data in columns). Not detected (N.D.) barcodes are shown in grey. Increased barcodes passing a change threshold are indicated in red, with those below the threshold in blue, and those not changed (neutral) in white. (B) Barcode intensity decreases for miR-150 were compared in individual recipient mice between Day 10 or Day 22 post-5-FU, and Week 11 pre-5-FU time-points. A total of 13 mice had a detectable miR-150 barcode signal associated with these time points, with mouse identification (ID) shown at bottom. Day 22 samples for cohort 2 (mice 6 to 10) did not pass quality control and are not shown (see Experimental Procedures). Solid red line indicates no change. Dashed red lines indicates +0.6 and −0.6 of log2-fold-change that were used as the change threshold in (A). (●) indicates that corresponding bar is not shown to the full height.
Figure 4
Figure 4. Forced expression of miR-150 and other candidates impairs hematopoietic recovery upon 5-FU treatment “Related to Figure S4”
Competitive recovery of transduced (GFP+) cells compared with non-transduced cells (GFP) in mosaic transplantation hosts are shown for Mac1+ myeloid, B220+ B-cell, CD3+ T-cell lineages, and CD41+ platelets in the peripheral blood. Green arrow indicates the time point of maximal difference between the miR-150 (A), miR-153-2 (B), miR-652 (C), and control cohorts in platelets, myeloid, B-cell, and T-cell lineages. GFP+/GFP ratios were normalized to that of Day -3 before 5-FU treatment. Error bars represent standard deviation of (N=15 for A, N=4 for B and C). * p<0.05.
Figure 5
Figure 5. miR-150-null bone marrow confers faster peripheral recovery upon 5-FU injury “Related to Figure S5”
(A) The homeostatic levels of blood parameters are indistinguishable between wild-type (WT) and miR-150 knockout littermates (KO). Complete blood counts are shown. WBC: white blood cells; HCT: hematocrit. Error bars indicate standard deviation of (N=12). (B) A schematic depicting competitive recovery assays comparing wild-type or miR-150 knockout cells with wild-type competitor bone marrow. Transplant recipients were tested for 5-FU injury response after donor bone marrow cells repopulated the recipient hematopoietic system and reached homeostasis. GFP was used to trace miR-150 knockout cells or those from wild-type liter mates. CD45.1 and CD45.2-based tracing was used in a parallel experiment (See also Fig S5G). (C) Competitive recovery of GFP+ miR-150 knockout cells or that of wild-type controls was compared with wild-type competitors (GFP) and measured by peripheral GFP+/GFP ratios. Data were from two independent cohorts and normalized to the ratios 3 days before 5-FU treatment. Error bars represent standard deviation of (N=12). Green arrow indicates the time-point with maximal difference between WT and KO cohorts for myeloid cells. * p<0.05.
Figure 6
Figure 6. Forced expression of miR-150 inhibits hematopoietic progenitor activity upon 5-FU-induced or irradiation injury “Related to Figure S6 and Table S4”
(A) Bone marrow cells transduced with miR-150 or a control vector (GFP+), and those not transduced (GFP), were sorted from transplant recipients and were subjected to colony formation assays. Both mice without 5-FU treatment and 6 days post-5-FU were analyzed. Results were from three pairs of miR-150 and control recipients. * p<0.05. (B) Bone marrow clonogenic potential from wild-type and miR-150 knockout mice were similarly assayed with or without 5-FU treatment (N=4). * p<0.05. (C) Spleen colony formation potential in miR-150 or control transplant recipients. Wild-type bone marrow was transduced with miR-150 or control vector. GFP+ cells were sorted and 1.5x10⁴ cells were injected into irradiated recipients. Ten days post transplantation, the numbers of spleen nodules were counted, and spleen weight was also determined. Images are representative of spleen morphology for each cohort (N=4). * p<0.05. All figure error bars depict the standard deviation. (D) LinKit+Sca+ HSPCs were transduced with miR-150 or a control vector, treated in vitro with or without 5-FU, and assayed at indicated days. AnnexinV+ cells were analyzed after gating on 7AAD population, for both transduced (GFP+) and untransduced (GFP) cells in the same culture. Error bars represent standard deviation of (N=3). * p<0.05. (E) Bone marrow cells from miR-150 or control-vector recipients were analyzed for apoptosis by examining the AnnexinV+ 7AAD population, in both Lin and Lin+ populations, 6 days after 5-FU treatment in vivo. Error bars represent standard deviation of (N=3).
Figure 7
Figure 7. Heterozygous loss of c-myb partially phenocopies miR-150 forced expression “Related to Figure S7”
(A) Schematic of competitive recovery of c-myb heterozygous knockout cells. CD45.1/.2+ MybF/+Mx1Cre+ bone marrow cells or MybF/+Mx1Cre cells were co-transplanted with CD45.2+ wild-type cells. After mice recovered from pIpC-induced deletion of c-myb, mice were challenged with 5-FU and competitive recovery was measured in peripheral blood. (B) The ratios of the test cells (CD45.1/.2) to competitor cells (CD45.2) were measured in peripheral blood before and after 5-FU treatment. The 45.1/45.2 ratios were normalized to the Day -3 time-point. Error bars represent standard deviation of (N=4). * p<0.05.

Similar articles

Cited by

References

    1. Ali N, Karlsson C, Aspling M, Hu G, Hacohen N, Scadden DT, Larsson J. Forward RNAi screens in primary human hematopoietic stem/progenitor cells. Blood. 2009;113:3690–3695. - PMC - PubMed
    1. Baltimore D, Boldin MP, O’Connell RM, Rao DS, Taganov KD. MicroRNAs: new regulators of immune cell development and function. Nature immunology. 2008;9:839–845. - PubMed
    1. Barroga CF, Pham H, Kaushansky K. Thrombopoietin regulates c-Myb expression by modulating micro RNA 150 expression. Experimental hematology. 2008;36:1585–1592. - PMC - PubMed
    1. Bartel DP. MicroRNAs: target recognition and regulatory functions. Cell. 2009;136:215–233. - PMC - PubMed
    1. Bezman Na, Chakraborty T, Bender T, Lanier LL. miR-150 regulates the development of NK and iNKT cells. The Journal of experimental medicine. 2011;208:2717–2731. - PMC - PubMed

Publication types

MeSH terms

Associated data