. 2012 Oct 25;2(4):964-75.
doi: 10.1016/j.celrep.2012.09.002. Epub 2012 Oct 19.

Pleiotrophin regulates the retention and self-renewal of hematopoietic stem cells in the bone marrow vascular niche

Affiliations

Pleiotrophin regulates the retention and self-renewal of hematopoietic stem cells in the bone marrow vascular niche

Heather A Himburg et al. Cell Rep. .

Erratum in

  • Cell Rep. 2012 Dec 27;2(6):1774

Abstract

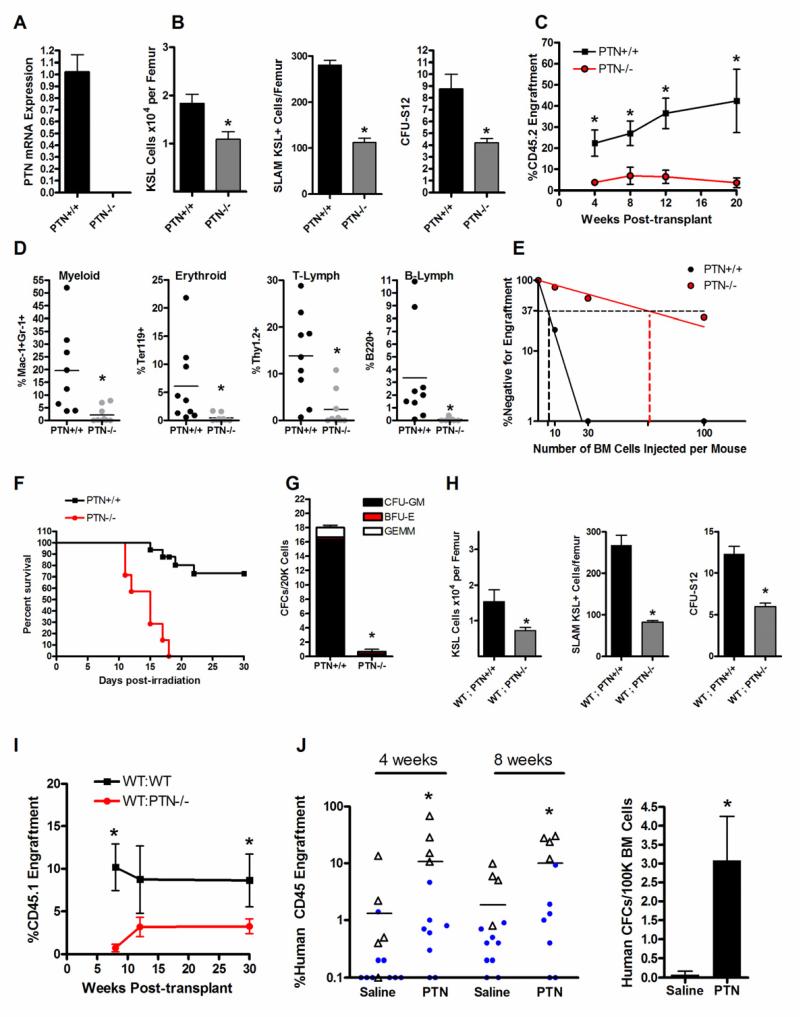
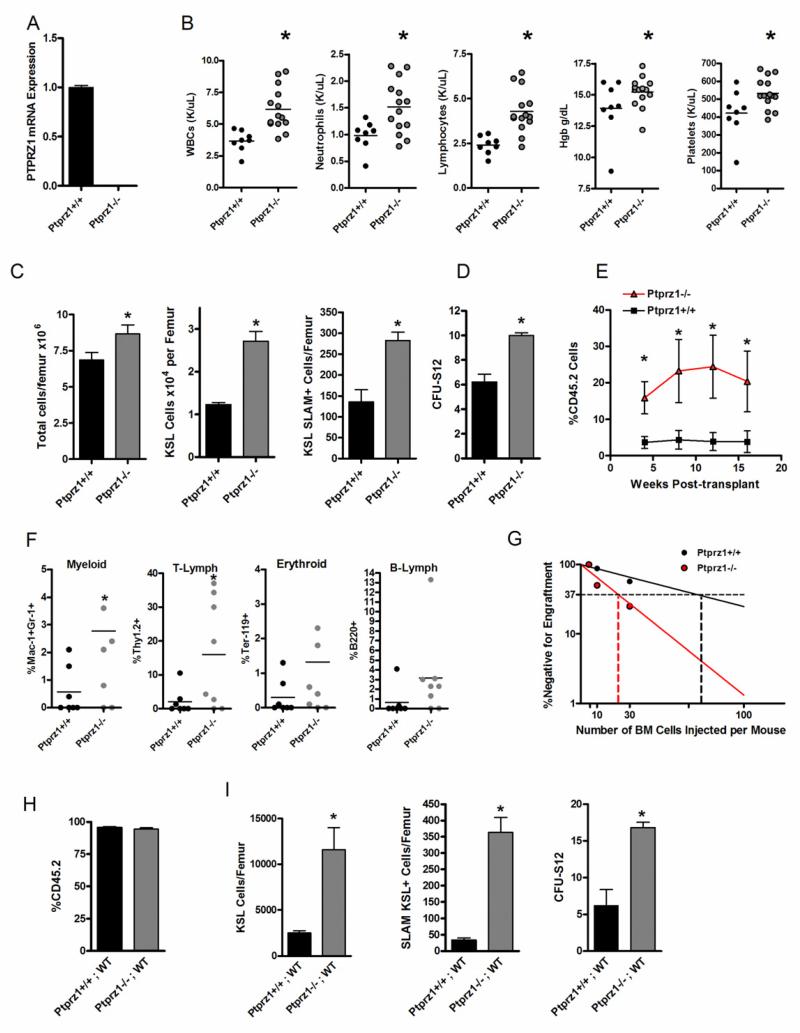
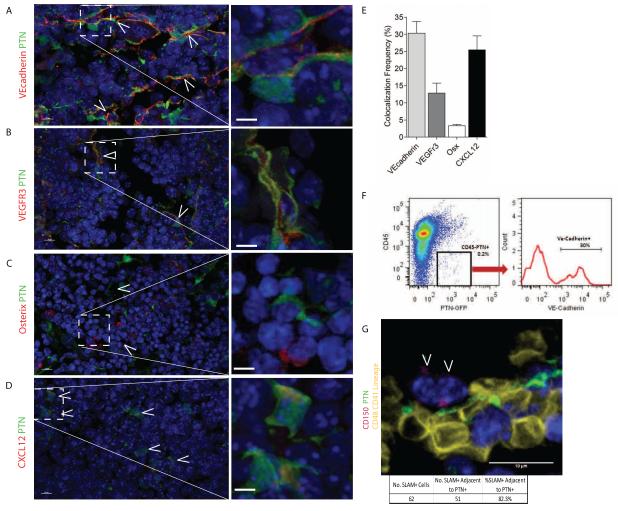
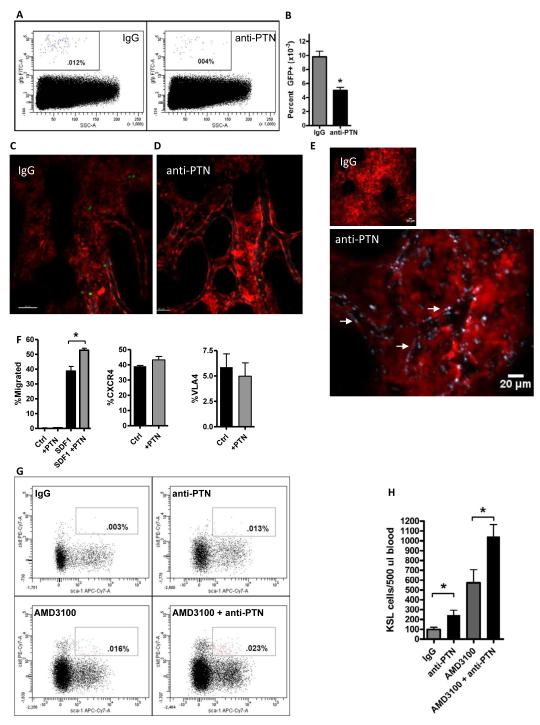
The mechanisms through which the bone marrow (BM) microenvironment regulates hematopoietic stem cell (HSC) fate remain incompletely understood. We examined the role of the heparin-binding growth factor pleiotrophin (PTN) in regulating HSC function in the niche. PTN(-/-) mice displayed significantly decreased BM HSC content and impaired hematopoietic regeneration following myelosuppression. Conversely, mice lacking protein tyrosine phosphatase receptor zeta, which is inactivated by PTN, displayed significantly increased BM HSC content. Transplant studies revealed that PTN action was not HSC autonomous, but rather was mediated by the BM microenvironment. Interestingly, PTN was differentially expressed and secreted by BM sinusoidal endothelial cells within the vascular niche. Furthermore, systemic administration of anti-PTN antibody in mice substantially impaired both the homing of hematopoietic progenitor cells to the niche and the retention of BM HSCs in the niche. PTN is a secreted component of the BM vascular niche that regulates HSC self-renewal and retention in vivo.


Figures

Figure 1
Figure 1. PTN Regulates HSC Self-Renewal and is Necessary for Hematopoietic Regeneration In Vivo
(A) Quantitative RT-PCR of PTN expression in the BM of PTN−/− mice and PTN+/+ mice. (B) PTN −/− mice contained significantly decreased BM KSL cells/femur, SLAM+KSL (CD150+CD48CD41linc-kit+sca-1+) cells/femur, and BM CFU-S12 compared to PTN+/+ mice (n=4 for KSL, n=3 for SLAM+KSL, n=5 for CFU-S12; * p = 0.01, * p = 0.0002, * p = 0.003 respectively). (C) CD45.1+ mice transplanted competitively with a limiting dose (30 cells) of BM CD34KSL cells from CD45.2+ PTN −/− mice demonstrated significantly decreased donor CD45.2+ cell engraftment over time compared to mice transplanted with the identical dose of BM CD34KSL cells from PTN +/+ mice (n=6-10 mice/group; 4 wks, * p=0.007; 8 wks, * p=0.006; 12 wks, * p=0.0008; 20 wks, * p = 0.02). (D) 12 week myeloid (Mac-1+), erythroid (Ter119+), T-cell (Thy 1.2+), and B-cell (B220+) cell engraftment (* p=0.004, * p=0.01, * p=0.002, and * p=0.02, respectively, for differences between recipients of BM from PTN +/+ and PTN −/− mice). (E) Poisson statistical analysis after limiting dilution transplant assay. Plots were obtained to allow estimation of CRU frequency in PTN +/+ and PTN −/− mice (n=9-10 mice transplanted at each cell dose per condition). The plot shows the percentage of recipient (CD45.1+) mice containing < 1% CD45.2+ cells (non-engrafted) in the PB at 12 weeks post-transplantation (Y axis) versus the number of cells injected per mouse (X axis). The horizontal line indicates the point where 37% of the mice are non-engrafted; the vertical lines highlight the CRU frequencies in each mouse (PTN−/− mice, 1/66, versus PTN +/+ mice, 1/6). (F) PTN −/− mice displayed increased radiosensitivity compared to PTN +/+ mice and failed to regenerate hematopoiesis following total body irradiation (TBI). Sixty-nine percent (11 of 16) of PTN +/+ mice were alive at day +30 following 700 cGy TBI (at left). Conversely, none of the PTN −/− mice (0 of 7) survived beyond day +18 (p<0.0001, log rank analysis). (G) PTN −/− mice contained > 15-fold decreased BM colony forming cells (CFCs) at day +20 following TBI compared to PTN +/+ mice (at right, n=3/group, * p=0.01). (H) WT;PTN −/− mice contained decreased BM KSL cells, decreased SLAM+KSL HSCs, and decreased CFU-S12 compared to WT;PTN+/+ mice (means ± SEM, n=8-9 for KSL and CFU-S12; n=3 for SLAM analysis; KSL, * p = 0.02; SLAM+KSL, * p = 0.02; CFU-S12, * p =0.002). (I) Mice competitively transplanted with a limiting dose (30 cells) of BM CD34KSL cells from WT;PTN −/− mice demonstrated significantly lower donor CD45.1+ cell engraftment over 4 - 30 weeks compared to mice transplanted with the identical dose of CD34KSL cells from WT;PTN +/+ mice (n=8 mice/group; 8 wks, * p=0.001; 30 wks, * p = 0.04. Error bars represent SEM for all experiments; Student’s t test was performed for comparisons). (J) NOD-SCID IL2Rγ−/− (NSG) mice were irradiated with 250 cGy and then transplanted with human CB mononuclear cells (5-10 × 105 cells/mouse; Experiment 1 represented by blue circles; Experiment 2 represented by open triangles) followed by intraperitoneal injections of 2 or 4 g PTN or saline on days +7, +10, and +13 post-transplant. PTN-treated mice displayed significantly increased human hematopoietic cell engraftment in the peripheral blood over time post-transplant compared to saline-treated controls (at left, n = 11-14 per group, 4 weeks *p = 0.04; 8 weeks *p=0.03). Horizontal bars represent mean levels of donor human CD45+ cell engraftment. Transplanted NSG mice that were treated with PTN demonstrated significantly increased human colony forming cells (CFCs) in the BM at 8 weeks compared to saline-treated NSG mice (at right, n = 4 mice/group, * p = 0.02).
Figure 2
Figure 2. Deletion of PTPRZ is Sufficient to Expand the BM HSC Pool
(A) Quantitative RT-PCR analysis of PTPRZ expression in Ptprz1+/+ and Ptprz1−/− mice. (B) Scatter plots show the complete blood counts in the PB of Ptprz1+/+ mice compared to Ptprz1 −/− mice (WBCs,* p = 0.005; Neutrophils, * p = 0.006; Lymphocytes, * p= 0.003; Hgb, * p = 0.04; Platelets, * p = 0.01). Mean values are represented by horizontal lines; n=8-13 mice per condition. (C) Ptprz1 −/− mice demonstrate increased mean BM cell counts, KSL cells/femur and SLAM+KSL cells/femur compared to Ptprz1+/+ mice (n=3-5 mice/group; * p = 0.04, * p = 0.003, * p = 0.002, respectively). Error bars represent SEM. (D) Ptprz1−/− mice contain increased BM CFU-S12 compared to Ptprz1+/+ mice (n = 7-9/group, p < 0.0001). (E) Mice transplanted with a limiting dose (30 cells) of BM CD34KSL cells from Ptprz1−/− mice demonstrated significantly higher donor CD45.2+ donor cell engraftment over time compared to recipients of the identical dose of CD34KSL cells from Ptprz1+/+ mice (means ± SEM are shown, n = 7-10 mice/group; 4 wks, * p = 0.01; 8 wks, * p = 0.03; 12 wks, * p = 0.03; 16 wks, *p = 0.04. Student’s t test for all comparisons). (F) Multilineage engraftment of myeloid, erythroid, T-cells, and B-cells is shown at 12 weeks post-transplantation; n = 7-8 mice/group, Myeloid, * p = 0.03; T-cell, * p = 0.02. (G) Poisson statistical analysis after limiting dilution transplant assay; plots were obtained to allow estimation of CRU frequency in Ptprz1+/+ mice (1 in 72) and Ptprz1−/− mice (1 in 23); n = 7-8 mice transplanted at each cell dose per condition. (H) The mean percent donor chimerism is shown at 8 weeks post-transplantation of BM cells from Ptprz1+/+ or Ptprz1−/− mice (CD45.2+) into lethally irradiated Bl6.SJL recipient (CD45.1+) mice (WT) to generate chimeric Ptprz1−/−;WT mice and Ptprz1+/+;WT mice. Mean donor cell chimerism was ≥95% in Ptprz1−/−;WT mice and Ptprz1+/+;WT mice (n = 4-5 mice/group, means ± SEM). (I) Ptprz1−/−;WT mice contained significantly increased BM KSL cells/femur, SLAM+KSL cells/femur and CFU-S12 compared to Ptprz1+/+;WT mice (n = 3-6/group, * p = 0.004, * p < 0.0001, and * p = 0.002, respectively). Data represent means ± SEM; Student’s t test for comparisons.
Figure 3
Figure 3. PTN Is Expressed by BM Endothelial Cells in the HSC Niche
(A) PTN-GFP reporter mice stained with VE-cadherin antibody (red) demonstrate that VE-cadherin+ ECs express PTN (green). White arrows indicate cells which express both PTN and VE-cadherin. Inset box is shown magnified at right, white scale bar represents 10 μm. (B) VEGFR3+ sinusoidal vessels (red) are shown which co-express PTN (green). White arrows indicate cells expressing both VEGFR3 and PTN; high power image at right. (C) Staining for osterix+ cells (red) indicates that very few osterix+ cells express PTN (green); high power image at right. (D) CXCL12-abundant reticular cells (CARs, red) were identified which co-expressed PTN (green). White arrows indicate cells expressing both PTN and CXCL12. (E) Quantification of percentage of VE-cadherin+, VEGFR3+, osterix (Osx)+, and CXCL12+ cells which co-expressed PTN. Osterix+ cells had the lowest amount of co-localization with PTN-GFP+ cells (3.3%), while 30% of VE-cadherin cells, 12.8% of VEGFR3+ cells and 25.5% of CXCL12+ cells co-expressed PTN (n=2-6 tissue sections/stain, Bars represent means +/− SEM). (F) Representative FACS analysis of BM cells from PTN-GFP reporter mice co-stained with CD45 and VE-cadherin antibodies, demonstrating that PTN is expressed by VE-cadherin+ cells. (G) Immunohistochemical staining for CD150+CD48CD41lineage cells in the femurs of PTN-GFP mice was performed. A representative image is shown. 82.3% (51 of 62) of the CD150+CD48CD41lineage cells (magenta) were within a 5 micron distance of PTN+ (green) cells in the BM (30 images analyzed from 5 femur sections).
Figure 4
Figure 4. PTN Regulates the Homing and Retention of BM HSPCs
(A) Systemic administration of anti-PTN significantly decreased HSPC homing to the BM niche. Representative FACS analysis is shown of percentage GFP+ donor hematopoietic cells in the BM of recipient C57Bl6 mice at 18 hours following intravenous infusion of BM Sca-1+linGFP+ cells after pre-treatment of recipient mice with either anti-PTN or IgG. (B) Anti-PTN treated mice contained > 2-fold decreased donor GFP+ cells in the BM at 18 hours post-infusion compared to IgG-treated control mice. n=5-6/group, means ± SEM, *p=0.0004. (C, D) Administration of anti-PTN inhibits the lodgment and transmigration of HPCs from the BM vasculature into the stem cell niche. Representative intravital images are shown of the calvarial BM space in living dsRed mice during the first 4 hours post-intravenous infusion of 3 × 10⁶ BM linGFP+ cells. Mice that were pre-treated with IgG antibody (C) demonstrated abundant homing of transplanted cells (green) from the BM sinusoidal vasculature (gray) into the niche, whereas mice pre-treated with anti-PTN displayed a markedly decreased number of donor HPCs within the extravascular BM space (D). A single GFP+ (green) cell is shown within the BM vasculature in the anti-PTN treated mice. See also Movies S1 and S2 for dynamic imaging of donor GFP+ hematopoietic progenitor cell homing in the BM of IgG-treated and anti-PTN treated mice. (E) Systemically administered anti-PTN binds extensively to the BM sinusoidal vasculature. Representative intravital imaging is shown of the calvarial BM of dsRed mice at 30 minutes after intravenous injection of either IgG-DyLight650 antibody (left, 20×, scale bar 50 μm) or anti-PTN-DyLight650 (middle, 20X, scale bar 50 μm). Binding and illumination of the BM sinusoidal vasculature by anti-PTN antibody (gray outline, white arrows) is shown in high power at right (4 times zoom of white box area in previous image, scale bar 20 μm). (F) Pre-incubation with PTN augments HPC migration to an SDF1 gradient. BM ckit+lin cells demonstrated no migration to media alone or PTN in a 4 hour transwell assay (left, n=4/group). A percentage of BM ckit+lin cells migrated to an SDF1 gradient in the lower chamber of transwell cultures. BM ckit+lin cells that were pre-incubated with PTN × 1 hour demonstrated significantly increased migration to SDF1 compared to control cultures at 4 hours in transwell assay. n=6/group, means ± SEM, *p=0.002 (left). Incubation of BM ckit+lin cells with PTN had no effect on cell surface expression of CXCR4 (middle) or VLA4 (right); n=6/group, means ± SEM. (G) Administration of anti-PTN promoted the rapid mobilization of HSPCs in wild type mice. Representative FACS plots are shown of the percentage of KSL cells in the PB of adult C57Bl6 mice at 1 hour following intravenous administration of IgG, anti-PTN, AMD3100 or AMD3100 + anti-PTN. Both anti-PTN and AMD3100 increased the mobilization of KSL cells to the PB compared to IgG-treated control mice. Mice treated with AMD3100 + anti-PTN displayed increased KSL cell mobilization compared to AMD3100 treatment alone. (H) The bar graphs show the means ± SEM of KSL cells in the PB of IgG-treated mice, anti-PTN treated mice, AMD3100-treated mice and mice treated with AMD3100 + anti-PTN. Treatment with anti-PTN alone or in combination with AMD3100 significantly increased KSL cell mobilization compared to IgG-treated or AMD3100-treated mice, respectively. *p=0.02 for anti-PTN versus IgG (n=8/group, means ± SEM), *p=0.03 for AMD3100 + anti-PTN versus AMD3100 alone (n=5/group, means ± SEM).

References

    1. Avigdor A, Goichberg P, Shivtiel S, Dar A, Peled A, Samira S, Kollet O, Hershkoviz R, Alon R, Hardan I, et al. CD44 and hyaluronic acid cooperate with SDF-1 in the trafficking of human CD34+ stem/progenitor cells to bone marrow. Blood. 2004;103:2981–2989. - PubMed
    1. Blank U, Karlsson G, Karlsson S. Signaling pathways governing stem-cell fate. Blood. 2008;111:492–503. - PubMed
    1. Butler JM, Nolan DJ, Vertes EL, Varnum-Finney B, Kobayashi H, Hooper AT, Seandel M, Shido K, White IA, Kobayashi M, et al. Endothelial cells are essential for the self-renewal and repopulation of Notch-dependent hematopoietic stem cells. Cell stem cell. 2010;6:251–264. - PMC - PubMed
    1. Calvi LM, Adams GB, Weibrecht KW, Weber JM, Olson DP, Knight MC, Martin RP, Schipani E, Divieti P, Bringhurst FR, et al. Osteoblastic cells regulate the haematopoietic stem cell niche. Nature. 2003;425:841–846. - PubMed
    1. Chute JP, Muramoto G, Fung J, Oxford C. Quantitative analysis demonstrates expansion of SCID-repopulating cells and increased engraftment capacity in human cord blood following ex vivo culture with human brain endothelial cells. Stem Cells. 2004;22:202–215. - PubMed

Publication types