

Interrelationship between HIV-1 fitness and mutation rate
- PMID: 23084856
- PMCID: PMC3534800
- DOI: 10.1016/j.jmb.2012.10.009
Interrelationship between HIV-1 fitness and mutation rate
Abstract
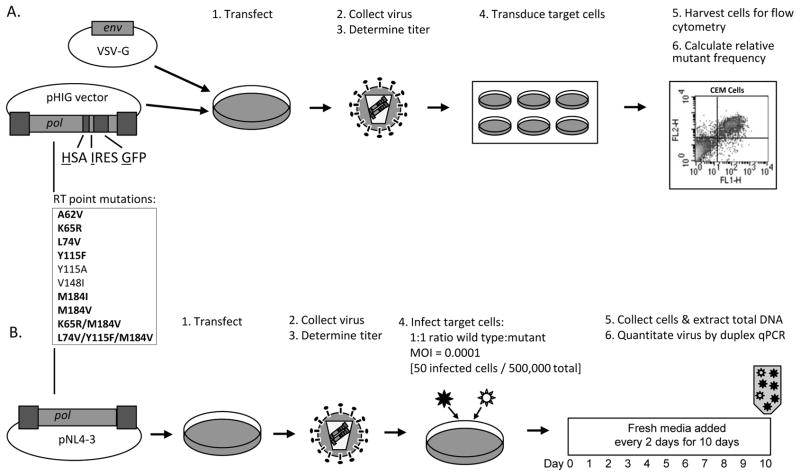
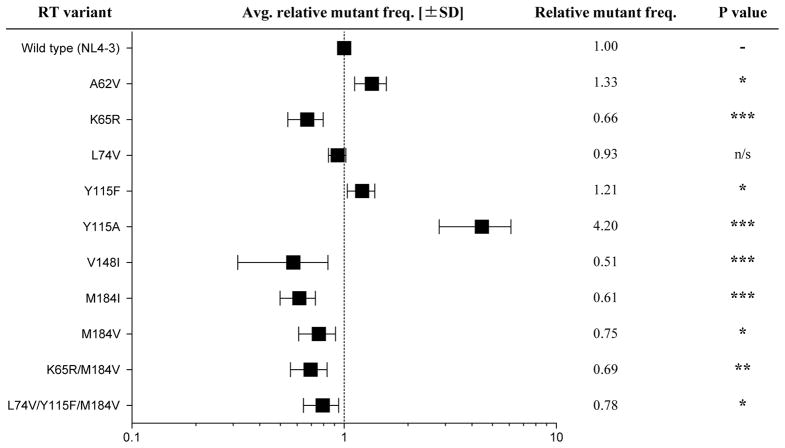
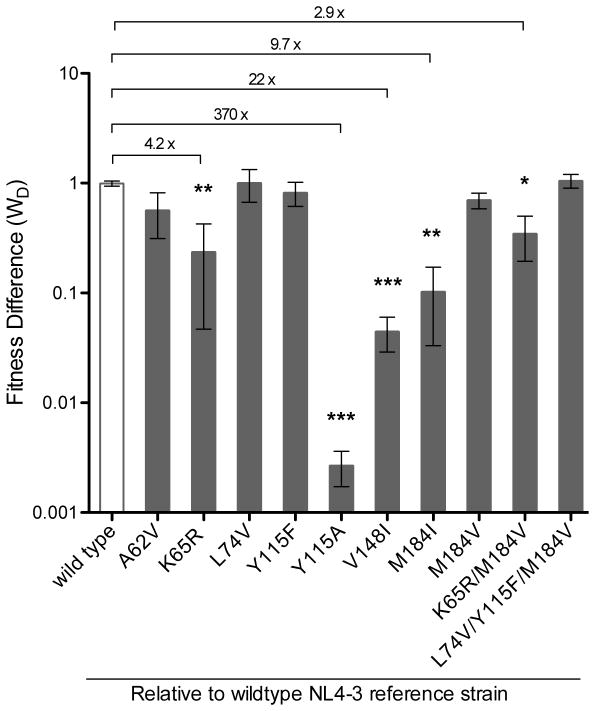
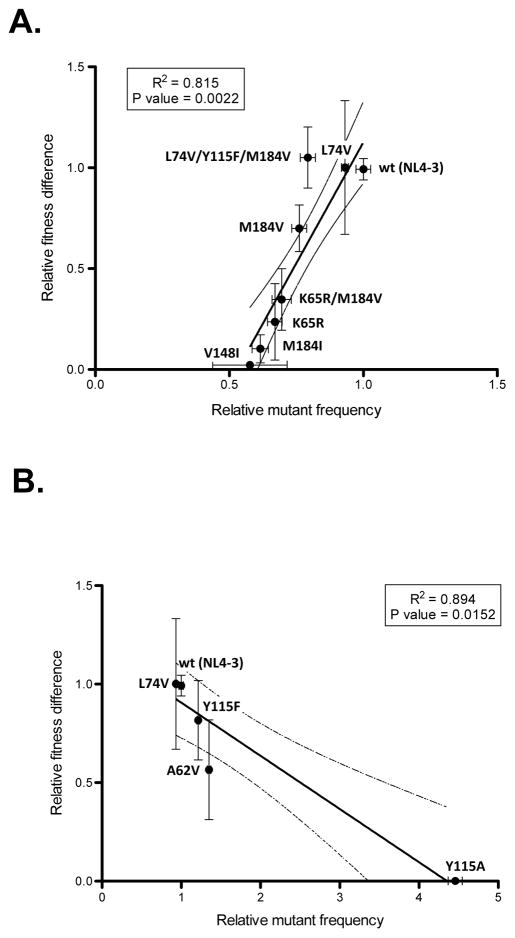
Differences in replication fidelity, as well as mutator and antimutator strains, suggest that virus mutation rates are heritable and prone to natural selection. Human immunodeficiency virus type 1 (HIV-1) has many distinct advantages for the study of mutation rate optimization given the wealth of structural and biochemical data on HIV-1 reverse transcriptase (RT) and mutants. In this study, we conducted parallel analyses of mutation rate and viral fitness. In particular, a panel of 10 RT mutants-most having drug resistance phenotypes-was analyzed for their effects on viral fidelity and fitness. Fidelity differences were measured using single-cycle vector assays, while fitness differences were identified using ex vivo head-to-head competition assays. As anticipated, virus mutants possessing either higher or lower fidelity had a corresponding loss in fitness. While the virus panel was not chosen randomly, it is interesting that it included more viruses possessing a mutator phenotype rather than viruses possessing an antimutator phenotype. These observations provide the first description of an interrelationship between HIV-1 fitness and mutation rate and support the conclusion that mutator and antimutator phenotypes correlate with reduced viral fitness. In addition, the findings here help support a model in which fidelity comes at a cost of replication kinetics and may help explain why retroviruses like HIV-1 and RNA viruses maintain replication fidelity near the extinction threshold.
Copyright © 2012 Elsevier Ltd. All rights reserved.
Figures
Similar articles
-
The HIV-1 Reverse Transcriptase A62V Mutation Influences Replication Fidelity and Viral Fitness in the Context of Multi-Drug-Resistant Mutations.Viruses. 2018 Jul 19;10(7):376. doi: 10.3390/v10070376. Viruses. 2018. PMID: 30029500 Free PMC article.
-
The high cost of fidelity.AIDS Res Hum Retroviruses. 2014 Jan;30(1):8-16. doi: 10.1089/AID.2013.0153. AIDS Res Hum Retroviruses. 2014. PMID: 24180375 Free PMC article. Review.
-
Diminished replicative fitness of primary human immunodeficiency virus type 1 isolates harboring the K65R mutation.J Clin Microbiol. 2005 Mar;43(3):1395-400. doi: 10.1128/JCM.43.3.1395-1400.2005. J Clin Microbiol. 2005. PMID: 15750116 Free PMC article.
-
The cost of replication fidelity in human immunodeficiency virus type 1.Proc Biol Sci. 2007 Jan 22;274(1607):225-30. doi: 10.1098/rspb.2006.3732. Proc Biol Sci. 2007. PMID: 17148251 Free PMC article.
-
HIV-1 reverse transcriptase inhibitor resistance mutations and fitness: a view from the clinic and ex vivo.Virus Res. 2008 Jun;134(1-2):104-23. doi: 10.1016/j.virusres.2007.12.021. Epub 2008 Mar 4. Virus Res. 2008. PMID: 18289713 Review.
Cited by
-
Mechanisms of Coronavirus Genome Stability As Potential Targets for Antiviral Drugs.Her Russ Acad Sci. 2022;92(4):470-478. doi: 10.1134/S1019331622040256. Epub 2022 Sep 6. Her Russ Acad Sci. 2022. PMID: 36091852 Free PMC article.
-
High-Sequence Diversity and Rapid Virus Turnover Contribute to Higher Rates of Coreceptor Switching in Treatment-Experienced Subjects with HIV-1 Viremia.AIDS Res Hum Retroviruses. 2017 Mar;33(3):234-245. doi: 10.1089/AID.2016.0153. Epub 2016 Oct 12. AIDS Res Hum Retroviruses. 2017. PMID: 27604829 Free PMC article.
-
Retroviral vectors for analysis of viral mutagenesis and recombination.Viruses. 2014 Sep 24;6(9):3612-42. doi: 10.3390/v6093612. Viruses. 2014. PMID: 25254386 Free PMC article. Review.
-
Population Heterogeneity in Mutation Rate Increases the Frequency of Higher-Order Mutants and Reduces Long-Term Mutational Load.Mol Biol Evol. 2017 Feb 1;34(2):419-436. doi: 10.1093/molbev/msw244. Mol Biol Evol. 2017. PMID: 27836985 Free PMC article.
-
Distinct Antiretroviral Mechanisms Elicited by a Viral Mutagen.J Mol Biol. 2021 Sep 3;433(18):167111. doi: 10.1016/j.jmb.2021.167111. Epub 2021 Jun 18. J Mol Biol. 2021. PMID: 34153286 Free PMC article.
References
Publication types
MeSH terms
Substances
Grants and funding
LinkOut - more resources
Full Text Sources
Other Literature Sources
Research Materials
