. 2012 Oct 18;12(4):558-70.
doi: 10.1016/j.chom.2012.08.010.

Short-range exosomal transfer of viral RNA from infected cells to plasmacytoid dendritic cells triggers innate immunity

Affiliations

Short-range exosomal transfer of viral RNA from infected cells to plasmacytoid dendritic cells triggers innate immunity

Marlène Dreux et al. Cell Host Microbe. .

Abstract

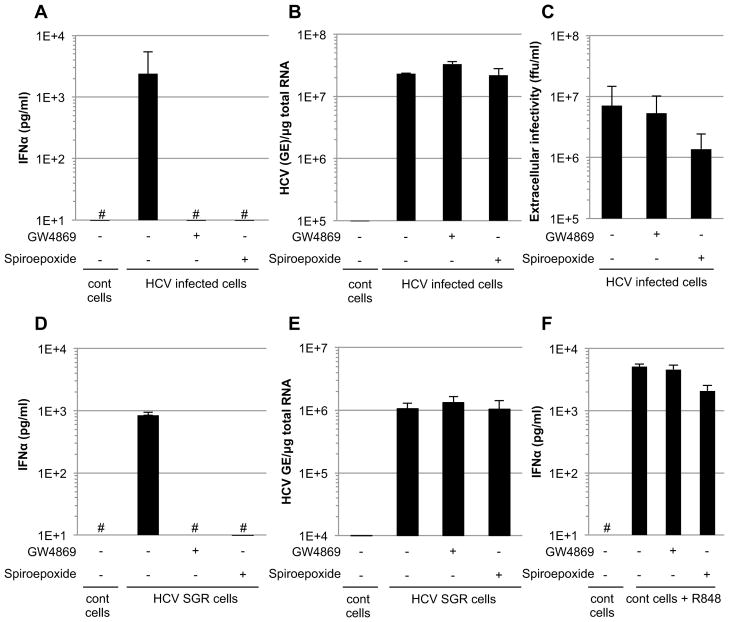
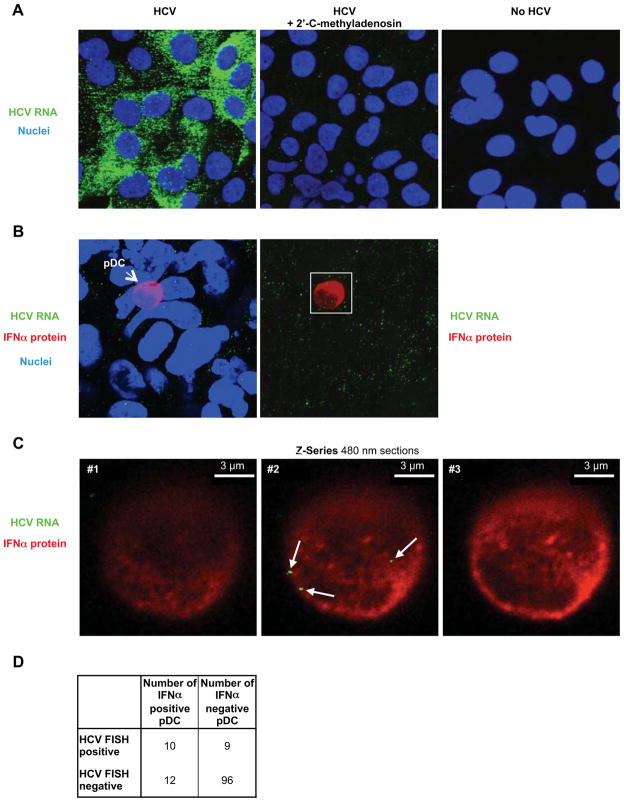
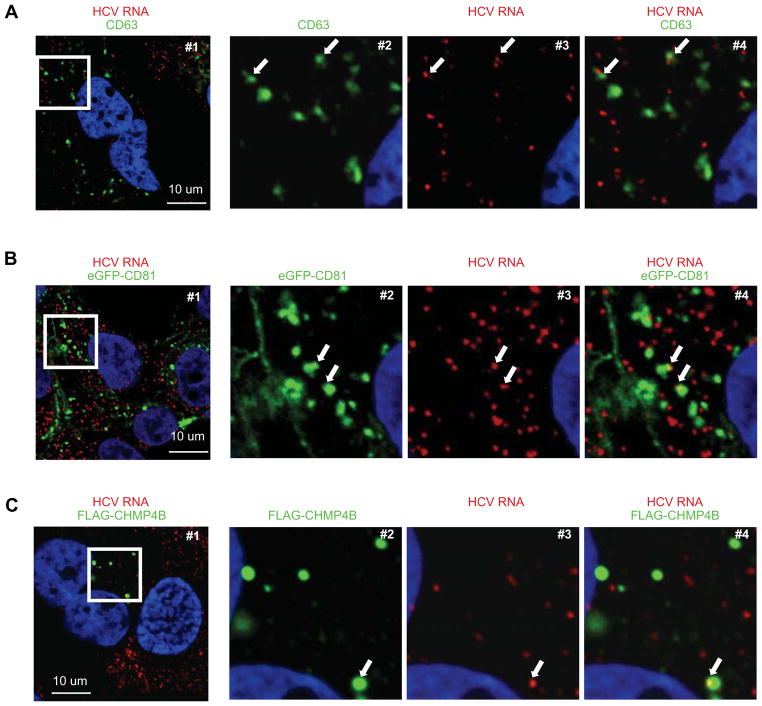
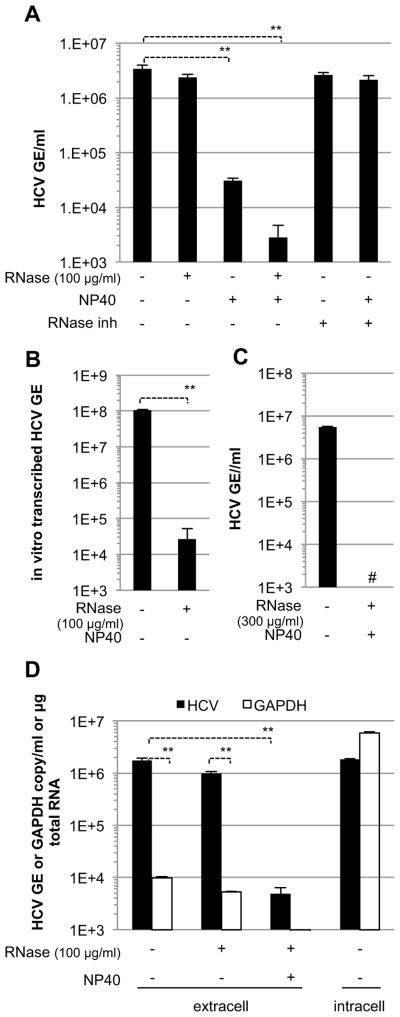
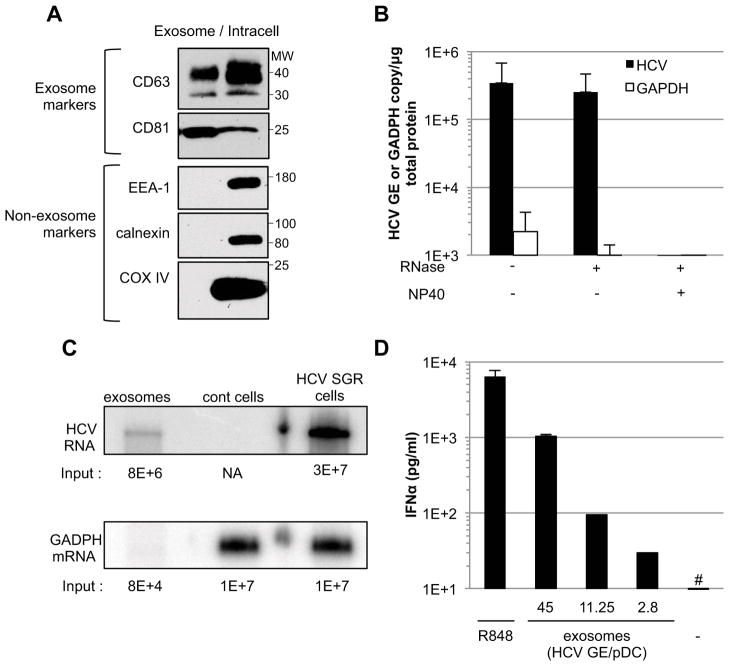
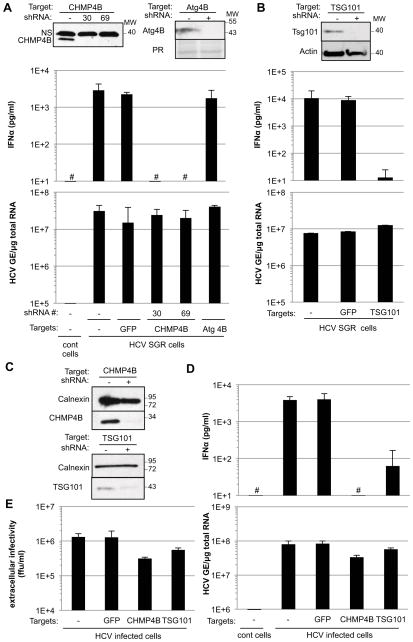
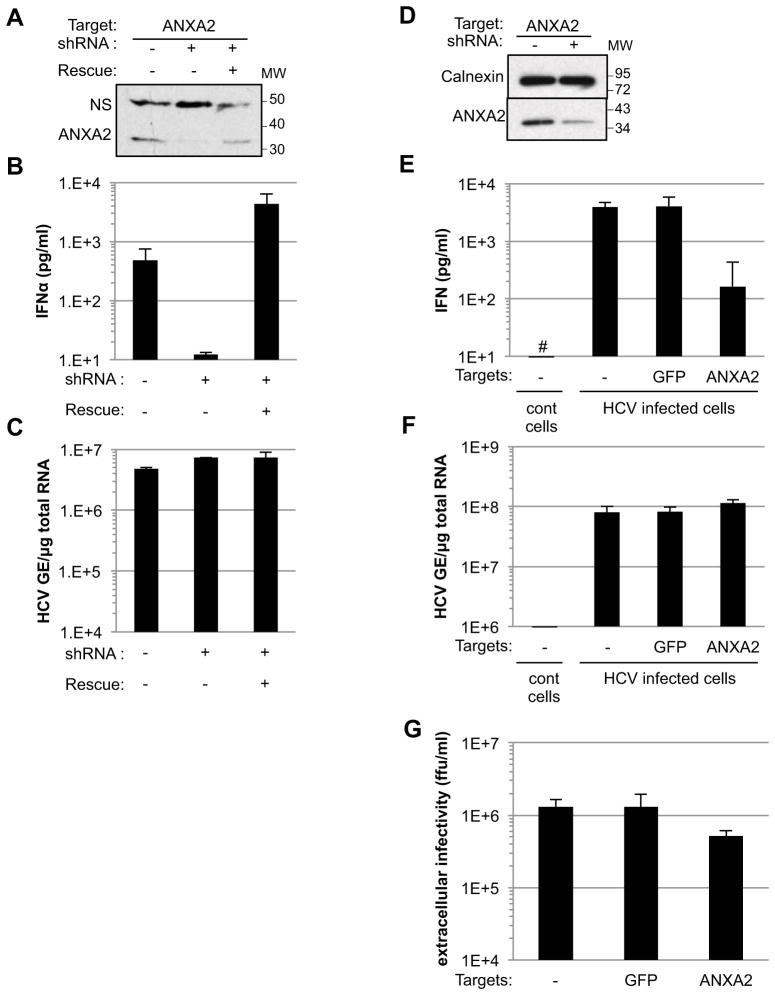
Viral nucleic acids often trigger an innate immune response in infected cells. Many viruses, including hepatitis C virus (HCV), have evolved mechanisms to evade intracellular recognition. Nevertheless, HCV-permissive cells can trigger a viral RNA-, TLR7-, and cell-contact-dependent compensatory interferon response in nonpermissive plasmacytoid dendritic cells (pDCs). Here we report that these events are mediated by transfer of HCV-RNA-containing exosomes from infected cells to pDCs. The exosomal viral RNA transfer is dependent on the endosomal sorting complex required for transport (ESCRT) machinery and on Annexin A2, an RNA-binding protein involved in membrane vesicle trafficking, and is suppressed by exosome release inhibitors. Further, purified concentrated HCV-RNA-containing exosomes are sufficient to activate pDCs. Thus, vesicular sequestration and exosomal export of viral RNA may serve both as a viral strategy to evade pathogen sensing within infected cells and as a host strategy to induce an unopposed innate response in replication-nonpermissive bystander cells.


Figures

Figure 1
Figure 1. Inhibition of pDC activation triggered by HCV infected and SGR cells by exosome release inhibitors
(A) Quantification of IFNα in supernatants of pDCs cocultured with HCV infected Huh-7.5.1c2 cells (MOI of 1 for 48 hours) that were treated or not with exosome-release inhibitors GW4869 or Spiroepoxide (10 and 5 μM, respectively) throughout the course of the coculture. Uninfected Huh-7.5.1c2 cells are referred to as control (cont) cells. The hatch marks (#) indicate results below the limit of detection of the IFNα ELISA (i.e 12.5 pg/ml). In parallel, the intracellular HCV RNA levels (B) and extracellular infectious virus production (C) of HCV infected cells treated with exosome release inhibitors were analyzed. (A–C) Results are representative of 2 independent experiments each performed in triplicate. Error bars represent the mean ± SD. (D) Quantification of IFNα in supernatants of pDCs cocultured with HCV SGR Huh-7.5.1c2 cells after treatment with exosome-release inhibitors GW4869 or Spiroepoxide (treatment with 10 and 5 μM, respectively) throughout the course of the coculture. HCV-negative Huh-7.5.1c2 cells served as controls (cont cells). (E) Intracellular HCV RNA levels in HCV SGR cells treated for 24-hours with exosome release inhibitors. (F) Parallel pDC/control cell cocultures were incubated with the TLR-7 ligand agonist R848 and supernatants were analyzed for IFNα. Results are representative of 3 independent experiments each performed in triplicate. Bar graphs depict the mean ± SD. The treatment conditions (i.e. incubation time and concentration) were exactly the same for the analysis of IFNα production, HCV RNA replication and extracellular infectious virus production. See also Figure S1.
Figure 2
Figure 2. HCV RNA is transferred from HCV SGR cells to pDCs
(A) Specificity of HCV RNA detection (green) by fluorescence in situ hybridization analysis (FISH) in HCV-infected Huh-7.5.1c2 cells that expressed high levels of HCV RNA (left panel), that were treated with the HCV polymerase inhibitor 2′-C-methyladenosine (5 μM for 24 hours) (middle panel) and in uninfected Huh-7.5.1c2 cells (no HCV, right panel). Nuclei are stained with Hoechst dye (blue). Projection (B) and consecutive Z-axis sections (C) of pDC cocultured with HCV SGR Huh-7.5.1c2 cells, 3.5-fold magnification of the white box in (B). HCV RNA (green), IFNα protein (red), nuclei (blue). HCV RNAs inside pDC are indicated (white arrows). Of note, FISH HCV RNA signals are lower in HCV SGR cells because they contain about 10-fold less HCV RNA than infected cells and in addition, FISH signals are reduced when combined with immunofluorescent staining (data not shown). Similar results were obtained in 5 independent experiments. (D) Summary table showing the fraction of total cocultured pDCs that contains HCV RNA.
Figure 3
Figure 3. Colocalization of HCV RNA, exosome markers in HCV SGR cells
Detection of HCV RNA (red), and in green CD63 (A), eGFP-CD81 (B) and FLAG-CHMP4B proteins (C), and nuclei (blue) in HCV SGR Huh-7.5.1c2 cells. Panels 2-to-4 correspond to a 3.6-fold magnification of the white box in #1 in each row. The arrows indicate HCV RNA in CD63-, CD81-, or CHMP4B-positive compartments. The frequencies of HCV SGR cells in which HCV RNA co-localized with CHMP4B, CD81 and CD63 were 25/29, 38/56 and 17/24 respectively. Results are representative of 3 independent experiments.
Figure 4
Figure 4. RNase-resistant HCV RNA is secreted from HCV SGR cells
HCV RNA levels in pre-cleared supernatants from HCV SGR Huh-7.5.1c2 cells (n=4, mean ± SD) (A), (n=2, mean ± SD) (C) and in vitro transcribed HCV RNA (n=3, mean ± SD) (B) were treated with RNase, NP40 and/or RNase inhibitor, as indicated. GE, genome equivalents. The hatch marks (#) indicate results below the detection limit of the assay (i.e. 500 HCV GE/ml). (D) HCV and GADPH RNA levels in pre-cleared supernatants from HCV SGR Huh-7.5.1c2 cells (extracell) either untreated or treated with RNase, NP40 and untreated SGR cell RNA (intracell), as indicated. Error bars represent the mean ± SD (n=3), Paired t-test student, ** p<0.005.
Figure 5
Figure 5. Exosomes prepared from HCV SGR cell supernatants trigger IFNα production by pDCs
(A) Comparison of exosome (CD63, CD81) and non-exosome (EEA-1, calnexin, COX IV) markers in exosomes prepared from HCV SGR Huh-7.5.1c2 cell supernatants and from the corresponding whole cell lysates (intracell) by immunoblotting. The molecular weight markers (MW, in kDa) are indicated to the right. (B) Exosome preparations were treated with NP40 and/or RNase and RT-qPCR results are expressed as HCV GE or GAPDH mRNA copies per μg of total protein. Error bars represent the mean ± SD (n=3). (C) Northern Blot analysis. The input copy number of HCV and GADPH RNA determined by RT-qPCR is indicated below each blot. NA, not applicable; Huh-7.5.1c2 cells served as negative control (cont cells) (D) pDCs (4×10⁵ cells) were incubated with concentrated exosomes at varying HCV GE/pDC ratios or with R848, a TLR7 agonist. The hatch marks (#) indicate results below the limit of detection of the IFNα ELISA (12.5 pg/ml). Results are representative of 2 independent experiments. Error bars represent the mean ± SD. See also Figure S2.
Figure 6
Figure 6. ESCRT proteins are required for production of the pDC-activating signal by HCV SGR and HCV infected cells
The impact of shRNA-mediated CHMP4B down-regulation, using two different shRNAs (#30 and #69, described in Table S1) (A) and shRNA-mediated TSG101 down-regulation (B) on expression of the corresponding proteins (upper panels), levels of IFNα in HCV SGR Huh-7.5.1c2 cell-pDC coculture supernatants (middle panels) and intracellular HCV RNA in Huh-7.5.1c2 SGR cells (lower panels) was compared with HCV SGR cells transduced with shRNA against GFP and an shRNA against an unrelated cellular protein (Atg4B) or non-transduced HCV SGR cells (-). HCV-negative Huh-7.5.1c2 cells served as controls (cont cells). The hatch marks (#) indicate results below the limit of detection of the IFNα ELISA (12.5 pg/ml). NS, non-specific band; PR, ponceau red staining; MW, molecular weight marker. Results are representative of 2 independent experiments each performed in triplicate. Error bars represent the mean ± SD. (C–E) CHMP4B and TSG101 down-regulated Huh7.5.1c2 cells, infected by HCV (MOI of 5 for 48 hours) were cocultured with pDCs for 20 hours. The levels of CHMP4B and TSG101 expression (C), IFNα in coculture supernatants (D, upper panel), intracellular HCV RNA (D, lower panel) and titration of HCV infectious particles in supernatants of the infected cells (E) were compared with control HCV infected cells transduced with shRNA against GFP. Uninfected Huh-7.5.1c2 cells served as controls (cont cells). Results are representative of 2 independent experiments each performed in triplicate. Error bars represent the mean ± SD. See also Figure S3.
Figure 7
Figure 7. ANXA2 is required for HCV infected and SGR cells to trigger IFNα production by pDCs
shRNA-mediated downregulaton of ANXA2 protein in HCV SGR Huh-7.5.1c2 cells (A), strongly reduced IFNα production by cocultured pDCs (B) but had no impact on HCV replication (C). All results were compared with ANXA2 shRNA-transduced HCV SGR Huh-7.5.1c2 cells that ectopically express an shRNA-resistant variant of ANXA2 (Rescue). NS, non specific band; MW, molecular weight markers. Results are representative of 2 independent experiments each performed in triplicate. The levels of down-regulation of ANXA2 expression in HCV infected Huh-7.5.1c2 cells (MOI of 5 for 48 hours) (D), of IFNα in HCV infected cell-pDC coculture supernatants (E), of intracellular HCV RNA in HCV infected cells (F), and of HCV infectious particles in supernatants of the infected cells (G) were compared with HCV infected cells transduced with an shRNA against GFP. HCV-negative Huh-7.5.1c2 cells served as controls (cont cells). The hatch marks (#) indicate results below the limit of detection of the IFNα ELISA (12.5 pg/ml). Error bars represent the mean ± SD. See also Figure S4.

Similar articles

Cited by

References

    1. Al-Nedawi K, Meehan B, Micallef J, Lhotak V, May L, Guha A, Rak J. Intercellular transfer of the oncogenic receptor EGFRvIII by microvesicles derived from tumour cells. Nat Cell Biol. 2008;10:619–624. - PubMed
    1. Alter H, Seeff LB. Recovery, persistence, and sequelae in hepatitis C virus infection: a perspective on long-term outcome. Semin Liver Dis. 2000;20:17–35. - PubMed
    1. Ariumi Y, Kuroki M, Maki M, Ikeda M, Dansako H, Wakita T, Kato N. The ESCRT system is required for hepatitis C virus production. PLoS ONE. 2011;6:e14517. - PMC - PubMed
    1. Asselin-Paturel C, Brizard G, Pin JJ, Briere F, Trinchieri G. Mouse strain differences in plasmacytoid dendritic cell frequency and function revealed by a novel monoclonal antibody. J Immunol. 2003;171:6466–6477. - PubMed
    1. Aukrust I, Hollas H, Strand E, Evensen L, Trave G, Flatmark T, Vedeler A. The mRNA-binding site of annexin A2 resides in helices C-D of its domain IV. J Mol Biol. 2007;368:1367–1378. - PubMed

Publication types