. 2012 Nov 7;16(5):588-600.
doi: 10.1016/j.cmet.2012.09.014. Epub 2012 Oct 18.

Gut-derived serotonin is a multifunctional determinant to fasting adaptation

Affiliations

Gut-derived serotonin is a multifunctional determinant to fasting adaptation

Grzegorz Sumara et al. Cell Metab. .

Abstract

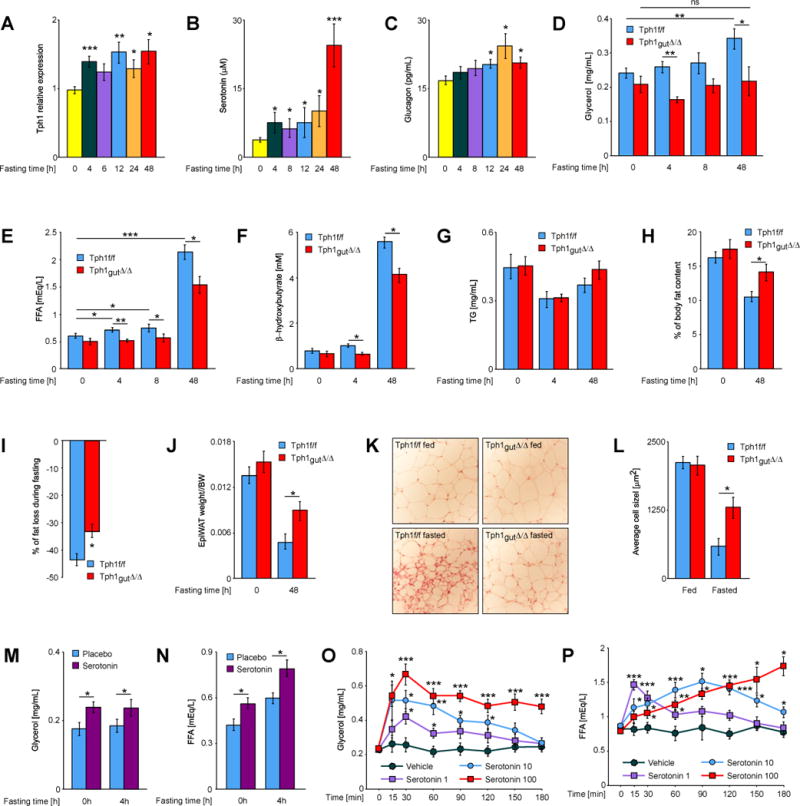
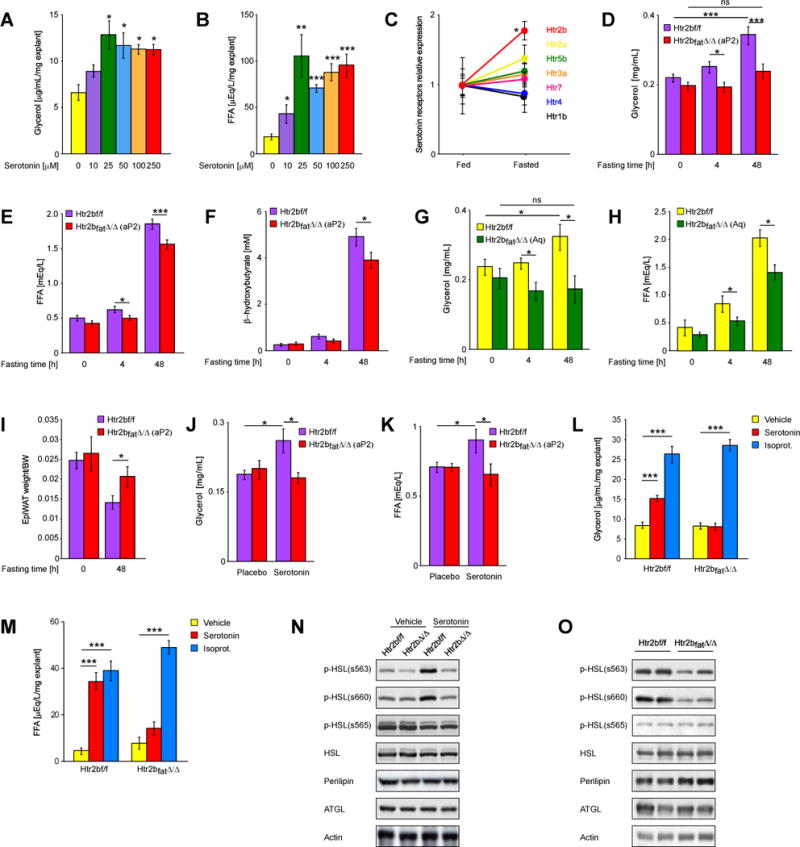
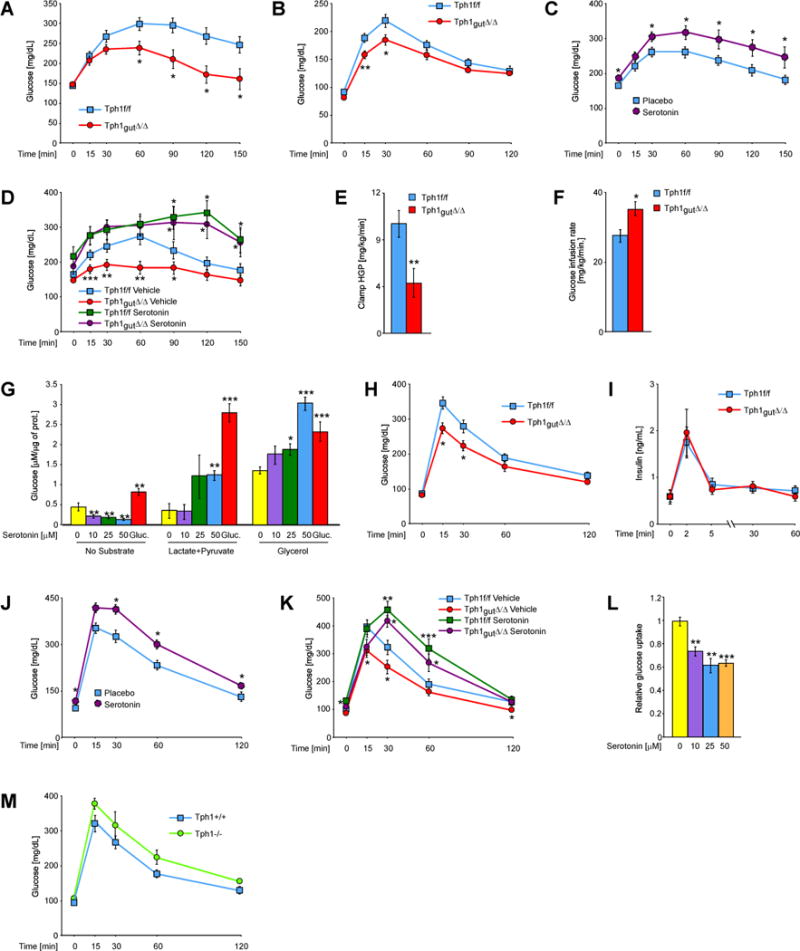
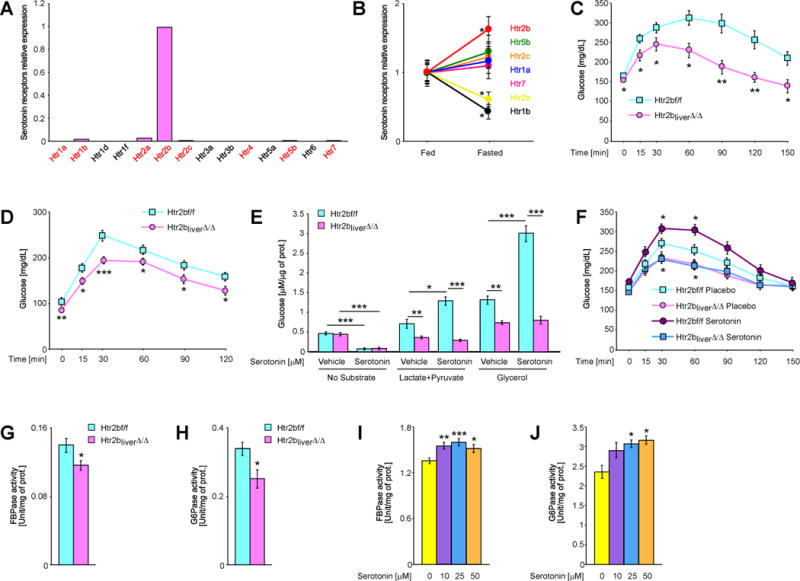
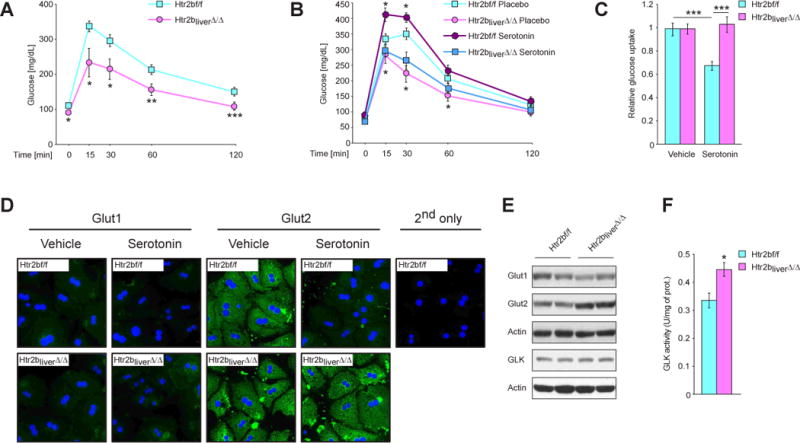
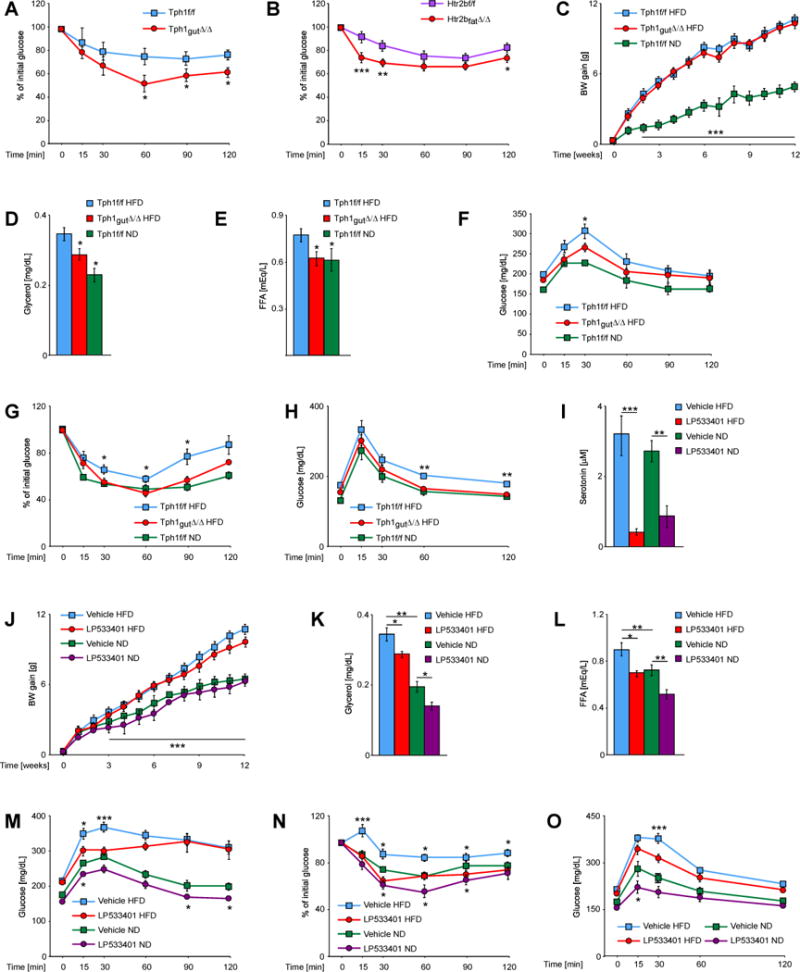
Energy release from cellular storage is mandatory for survival during fasting. This is achieved through lipolysis and liver gluconeogenesis. We show here that in the mouse, gut-derived serotonin (GDS) is upregulated during fasting and that it favors both mechanisms. In adipocytes, GDS signals through the Htr2b receptor to favor lipolysis by increasing phosphorylation and activity of hormone-sensitive lipase. In hepatocytes, GDS signaling through Htr2b promotes gluconeogenesis by enhancing activity of two rate-limiting gluconeogenic enzymes, FBPase and G6Pase. In addition, GDS signaling in hepatocytes prevents glucose uptake in a Glut2-dependent manner, thereby further favoring maintenance of blood glucose levels. As a result, inhibition of GDS synthesis can improve glucose intolerance caused by high-fat diet. Hence, GDS opposes deleterious consequences of food deprivation by favoring lipolysis and liver gluconeogenesis while preventing glucose uptake by hepatocytes. As a result, pharmacological inhibition of its synthesis may contribute to improve type 2 diabetes.


Figures

Fig. 1
Fig. 1. GDS is required for fasting induced lipolysis
(A) Relative expression levels of Tph1 in duodenum from mice fasted for indicated times (n ≥ 5). (B) Plasma levels of serotonin and (C) glucagon in mice fasted for indicated times (n ≥ 5). Plasma levels of (D) glycerol, (E) FFAs, (F) β-hydroxybutyrate and (G) triglycerides in mice of indicated genotypes fasted for indicated times (n ≥ 7). (H) % of fat content in fed and fasted mice of indicated genotypes measured by magnetic resonance imaging (MRI) (n ≥ 5). (I) % of fat content loss during 48h fasting in relation to initial fat content of each animal, average of 5 mice of Tph1f/f and Tph1gut∆/∆ genotype. (J) Epigonadal fat pad weight to body weight ratio in fed and fasted Tph1f/f and Tph1gut∆/∆ mice (n ≥ 6). (K) Histology of fat pad from fed and 48h fasted Tph1f/f and Tph1gut∆/∆ mice (n ≥ 5). (L) Average size of adipocytes from fat pad of fed and 48h fasted Tph1f/f and Tph1gut∆/∆ mice (n ≥ 5). Plasma levels of (M) glycerol and (N) FFAs in mice with implanted placebo or serotonin-releasing pellets fasted for indicated time (n ≥ 8). Plasma levels of (O) glycerol and (P) FFAs at indicated time points after i.p. injection of serotonin (doses in mg/kg BW) (n ≥ 5). Data represented as mean +/− SEM, *P < 0.05, **P < 0.01, ***P < 0.001.
Fig. 2
Fig. 2. GDS favors lipolysis through Htr2b receptor expressed in adipocytes
(A) Glycerol and (B) FF As release from mouse epigonadal fat explants stimulated with indicated doses of serotonin (n > 5). (C) Relative expression of indicated serotonin receptors in adipose tissue of fed and fasted mice. Plasma levels of (D) glycerol, (E) FF As and (F) β-hydroxybutyrate in mice lacking Htr2b in adipose tissue (deletion by aP2-Cre – indicated on graphs Htr2bfatΔ/Δ (aP2)) fasted for indicated times (n ≥ 20). Plasma levels of (G) glycerol and (H) FFAs in mice lacking Htr2b in adipose tissue (deletion by Adiponectin-Cre – indicated on graphs Htr2bfatΔ/Δ (Aq) fasted for indicated times (n > 6). (I) Epigonadal fat pad weight to body weight ratio in fed and fasted Htr2bf/f and Htr2bfatΔ/Δ(aP2) mice (n > 12). (J) Glycerol and (K) FFAs levels in Htr2bf/f and Htr2bfatΔ/Δ(aP2) mice implanted with serotonin-releasing pellets. (L) Glycerol and (M) FFAs release from epigonadal fat explants isolated from Htr2bf/f and Htr2bfatA/A(aP2) mice and stimulated with 50μM serotonin or 1μM isoproterenol (n = 5). (N) Western blot analysis of expression and activation of indicated proteins in fat explants isolated from Htr2bf/f and Htr2bfatΔ/Δ(aP2) mice and stimulated with 50μM serotonin. (O) Western blot analysis of expression and activation of indicated proteins in fat pads isolated from Htr2bf/f and Htr2bfatΔ/Δ(aP2) mice fasted for 48h. Data represented as mean +/− SEM, *P < 0.05, ***P < 0.001.
Fig. 3
Fig. 3. GDS promotes gluconeogenesis in liver
(A) Glycerol-evoked glucose production in Tph1f/f and Tph1gut∆/∆ mice (n ≥ 8). (B) Pyruvate tolerance test in Tph1f/f and Tph1gut∆/∆ mice (n ≥ 8). (C) Glycerol tolerance test in mice with implanted placebo or serotonin-releasing pellets (n ≥ 8). (D) Glycerol-evoked glucose production in Tph1f/f and Tph1gut∆/∆ mice injected with serotonin (10 mg/kg BW) 90min. before the test (n ≥ 7). Hepatic glucose production (E) and (F) glucose infusion rate during hyperinsulinemic-euglycemic clamp in Tph1f/f and Tph1gut∆/∆ mice (n ≥ 7). (G) Production of glucose from indicated substrates by primary hepatocytes stimulated with indicated doses of serotonin or 100nM glucagon (n = 5). (H) Glucose tolerance test in Tph1f/f and Tph1gut∆/∆ mice (n ≥ 7). (I) Plasma insulin levels during glucose tolerance test in Tph1f/f and Tph1gut∆/∆ mice (n ≥ 7). (J) Glucose tolerance test in mice with implanted placebo or serotonin-releasing pellets (n ≥ 8). (K) Glucose tolerance test in Tph1f/f and Tph1gut∆/∆ mice injected with serotonin (10 mg/kg BW) 90min. before the test (n ≥ 7). (L) Glucose uptake in primary hepatocytes stimulated with indicated doses of serotonin. (M) Glucose tolerance test in Tph1+/+ and Tph1−/− mice (n ≥ 3). Data represented as mean +/− SEM, *P < 0.05, **P < 0.01, ***P < 0.001.
Fig. 4
Fig. 4. GDS promotes gluconeogenesis in liver by signaling through the Htr2b receptor
(A) Relative expression of indicated serotonin receptors in primary mouse hepatocytes. Red color indicates receptors for which the transcript was detected. (B) Relative expression of indicated serotonin receptors in liver of fed and fasted mice. (C) Glycerol tolerance test in Htr2bf/f and Htr2bliver∆/∆ mice (n ≥ 7). (D) Pyruvate tolerance test in Htr2bf/f and Htr2bliver∆/∆ mice (n ≥ 7). (E) Production of glucose from indicted substrates by hepatocytes isolated from Htr2bf/f and Htr2bliver∆/∆ mice and stimulated by 50μM serotonin (n = 5). (F) Glycerol tolerance test in Htr2bf/f and Htr2bliver∆/∆ mice implanted with placebo or serotonin-releasing pellets (n ≥ 6). Normalized (G) FBPase and (H) G6Pase activity in livers of fasted Htr2bf/f and Htr2bliver∆/∆ mice (n ≥ 6). Normalized (I) FBPase and (J) G6Pase activity in isolated hepatocytes stimulated with indicated doses of serotonin (n ≥ 3). Data represented as mean +/− SEM, *P < 0.05, **P < 0.01, ***P < 0.001.
Fig. 5
Fig. 5. GDS inhibits glucose uptake in liver by signaling through the Htr2b receptor
(A) Glucose tolerance test in Htr2bf/f and Htr2bliver∆/∆ mice (n ≥ 8). (B) Glucose tolerance test in Htr2bf/f and Htr2bliver∆/∆ mice implanted with placebo or serotonin-releasing pellets (n ≥ 6). (C) Relative glucose uptake in Htr2b-deficient hepatocytes stimulated with 50 μM serotonin. (D) Immunofluorescence with antibodies against Glut1 and Glut2 on primary hepatocytes of indicated genotypes stimulated with 50μM serotonin. (E) Western blot analysis of expression of indicated proteins in livers from fasted Htr2bf/f and Htr2bliver∆/∆ mice. (F) Normalized glucokinase activity in livers of fasted Htr2bf/f and Htr2bliver∆/∆ mice. Data represented as mean +/− SEM, *P < 0.05, **P < 0.01, ***P < 0.001.
Fig. 6
Fig. 6. Inhibition of GDS synthesis protects from type 2 diabetes
(A) Insulin tolerance test in Tph1f/f and Tph1gut∆/∆ mice (n ≥ 7). (B) Insulin tolerance test in Htr2bf/f and Htr2bfat∆/∆ mice (n ≥ 12). (C) Body weight gain of Tph1f/f and Tph1gut∆/∆ mice fed normal or high fat diet (n ≥ 5). Plasma levels of (D) glycerol and (E) FFAs in mice of indicated genotypes fed normal (ND) or high fat diet (HFD), fasted for 4h (n ≥ 5). (F) Pyruvate, (G) insulin and (H) glucose tolerance tests in Tph1f/f and Tph1gut∆/∆ mice on indicated diets (n ≥ 5). (I) Plasma serotonin concentrations in mice treated with vehicle or LP533401 inhibitor (n ≥ 8). (J) Body weight gain of mice treated with vehicle or LP533401 inhibitor, fed ND or HFD (n ≥ 8). Plasma levels of (K) glycerol and (L) FFAs in mice treated with vehicle or LP533401 inhibitor fed ND or HFD and fasted for 4h (n ≥ 7). (M) Pyruvate, (N) insulin and (O) glucose tolerance tests in mice treated with vehicle or LP533401 inhibitor fed ND or HFD (n > 7). Data represented as mean +/− SEM, *P < 0.05, **P < 0.01, ***P < 0.001.

Similar articles

Cited by

References

    1. Alegre M, Ciudad CJ, Fillat C, Guinovart JJ. Determination of glucose-6-phosphatase activity using the glucose dehydrogenase-coupled reaction. Anal Biochem. 1988;173:185–189. - PubMed
    1. Amireault P, Hatia S, Bayard E, Bernex F, Collet C, Callebert J, Launay JM, Hermine O, Schneider E, Mallet J, et al. Ineffective erythropoiesis with reduced red blood cell survival in serotonin-deficient mice. Proceedings of the National Academy of Sciences of the United States of America. 2011;108:13141–13146. - PMC - PubMed
    1. Anthonsen MW, Ronnstrand L, Wernstedt C, Degerman E, Holm C. Identification of novel phosphorylation sites in hormone-sensitive lipase that are phosphorylated in response to isoproterenol and govern activation properties in vitro. The Journal of biological chemistry. 1998;273:215–221. - PubMed
    1. Backhed F, Ding H, Wang T, Hooper LV, Koh GY, Nagy A, Semenkovich CF, Gordon JI. The gut microbiota as an environmental factor that regulates fat storage. Proceedings of the National Academy of Sciences of the United States of America. 2004;101:15718–15723. - PMC - PubMed
    1. Berger M, Gray JA, Roth BL. The expanded biology of serotonin. Annual review of medicine. 2009;60:355–366. - PMC - PubMed

Publication types

MeSH terms