. 2013 Jan;25(1):359-71.
doi: 10.1016/j.cellsig.2012.10.009. Epub 2012 Oct 17.

CIKS (Act1 or TRAF3IP2) mediates high glucose-induced endothelial dysfunction

Affiliations

CIKS (Act1 or TRAF3IP2) mediates high glucose-induced endothelial dysfunction

Balachandar Venkatesan et al. Cell Signal. 2013 Jan.

Abstract

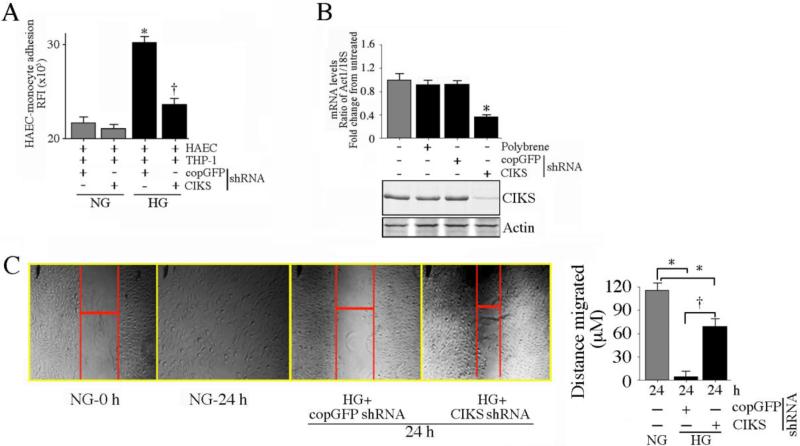
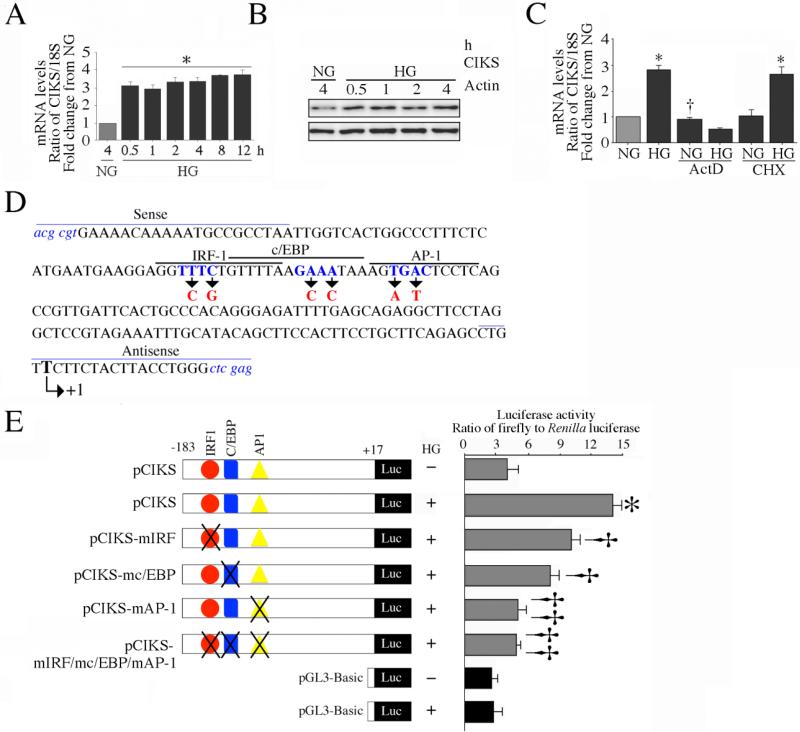
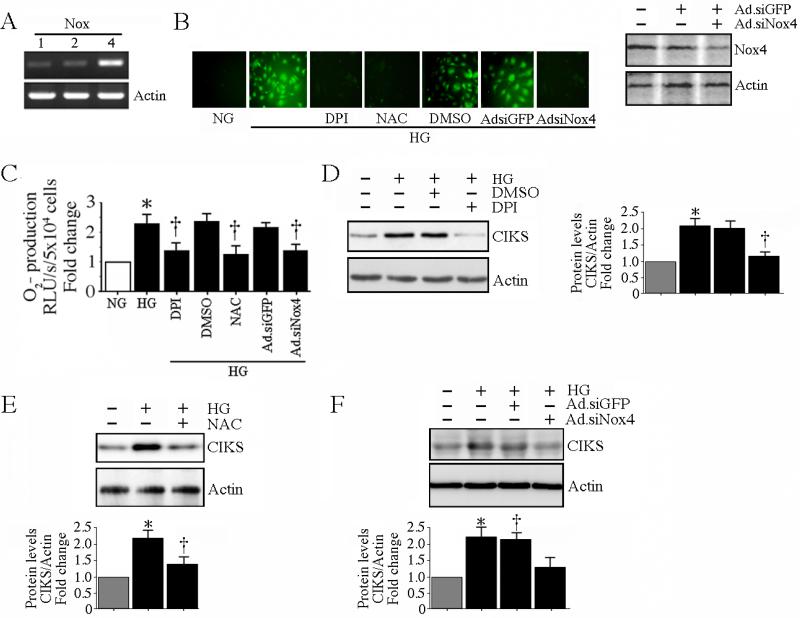
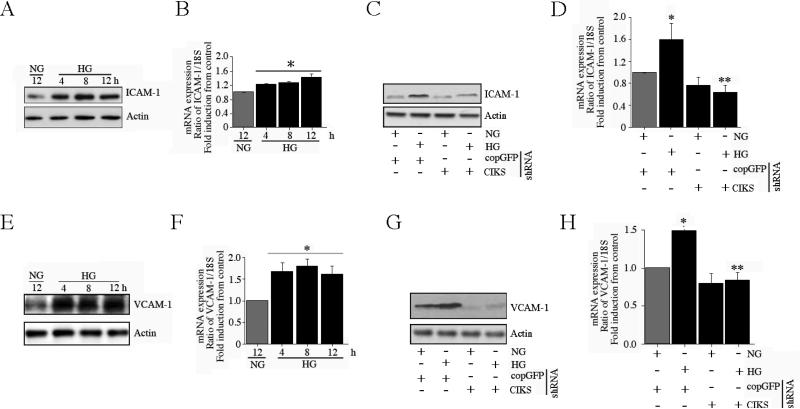
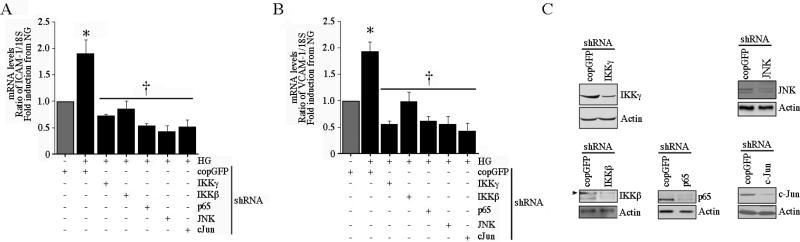
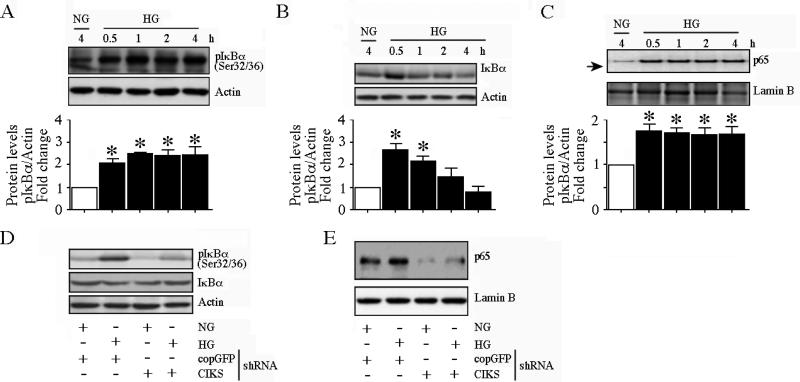
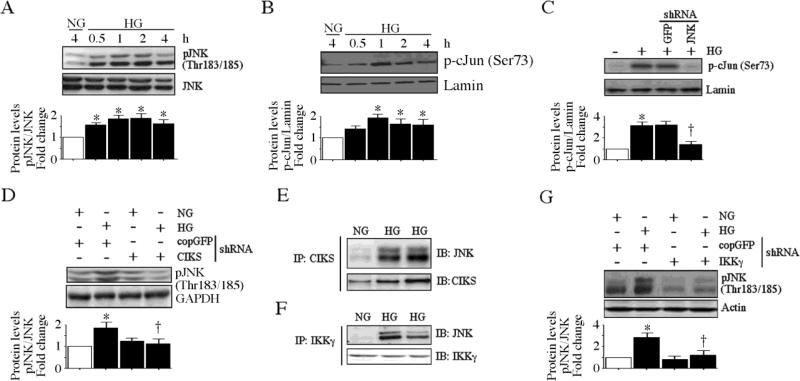
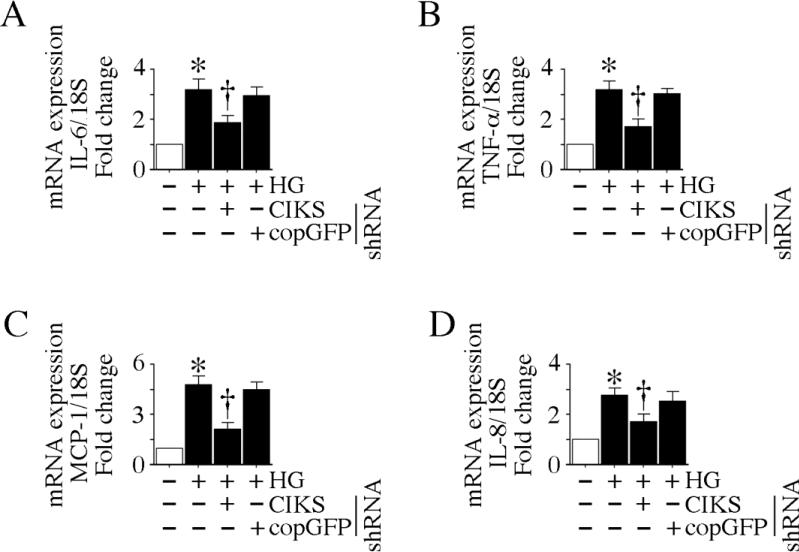
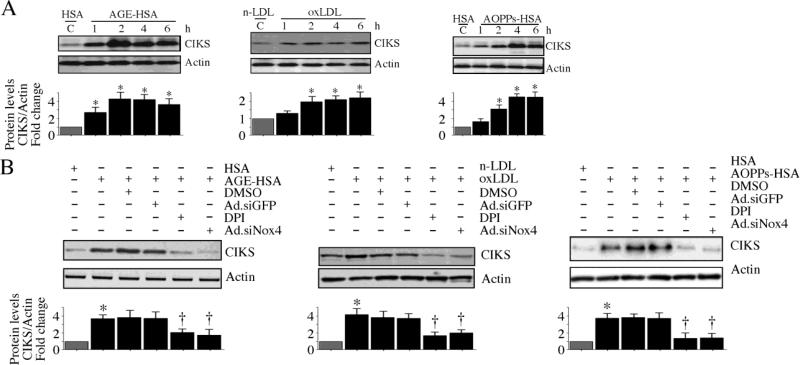
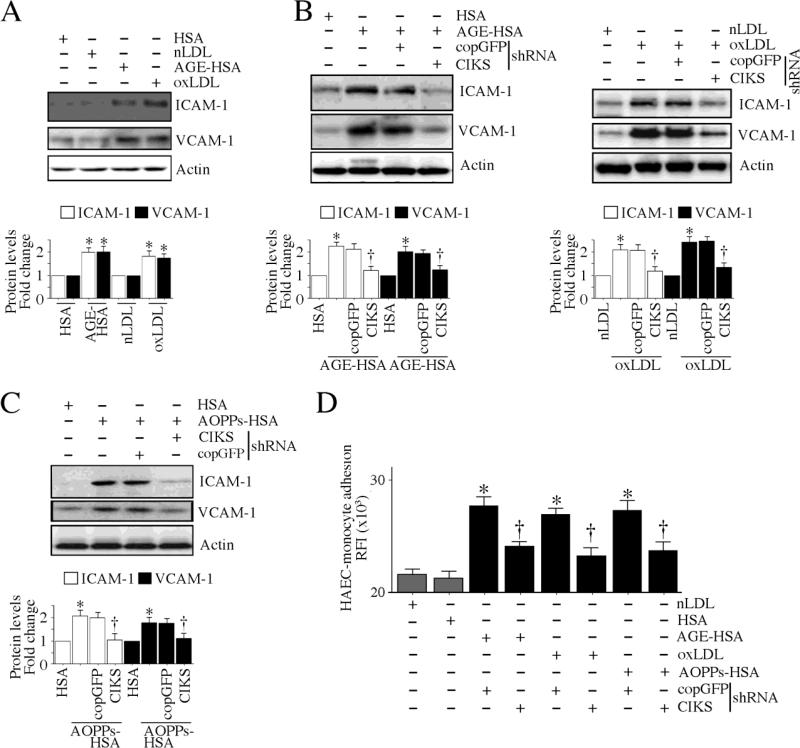
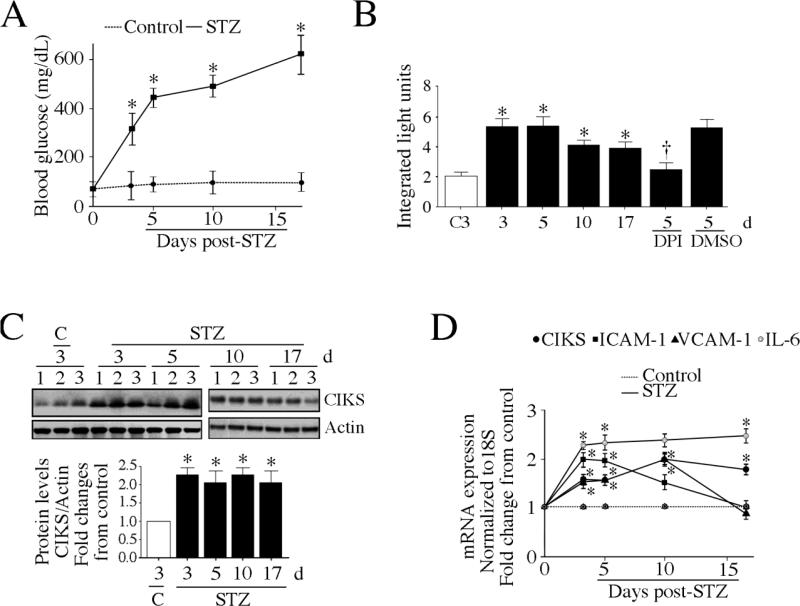
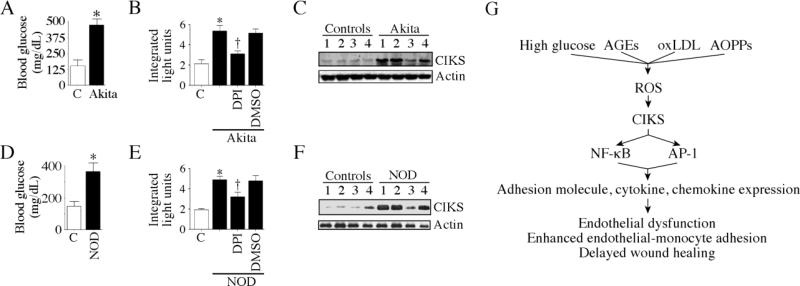
Hyperglycemia-induced endothelial dysfunction is characterized by enhanced inflammatory cytokine and adhesion molecule expression, and endothelial-monocyte adhesion. The adapter molecule CIKS (connection to IKK and SAPK/JNK; also known as Act1 or TRAF3IP2) is an upstream regulator of NF-κB and AP-1, and plays a role in inflammation and injury. Here we show that high glucose (HG; 25mM vs. 5mM d-glucose)-induced endothelial-monocyte adhesion and inhibition of endothelial cell (EC) migration were both reversed by CIKS knockdown. In EC, HG induced CIKS mRNA and protein expression via DPI-inhibitable Nox4-dependent ROS generation. Further, HG induced CIKS transcription and enhanced CIKS promoter-dependent reporter gene activation via Nox4, ROS, AP-1 and C/EBP. Coimmunoprecipitation and immunoblotting revealed CIKS/IKKβ/JNK physical association under basal conditions that was enhanced by HG treatment. Importantly, CIKS knockdown inhibited HG-induced (i) IKKβ and JNK phosphorylation, (ii) p65 and c-Jun nuclear translocation, and (iii) NF-κB- and AP-1-dependent proinflammatory cytokine, chemokine, and adhesion molecule expression. Similar to HG, the deleterious metabolic products of chronic hyperglycemia, AGE-HSA, AOPPs-HSA and oxLDL, also induced CIKS-dependent endothelial dysfunction. Notably, aortas from streptozotocin-induced and the autoimmune type 1 diabetic NOD and Akita mice showed enhanced DPI-inhibitable ROS generation and CIKS expression. Since CIKS mediates high glucose-induced NF-κB and AP-1-dependent inflammatory signaling and endothelial dysfunction, targeting CIKS may delay progression of vascular diseases during diabetes mellitus and atherosclerosis.


Figures

Fig. 1
Fig. 1. CIKS mediates high glucose-induced endothelial-monocyte adhesion and suppression of HAEC migration
Primary human aortic endothelial cells (HAEC) at 50% confluency were infected with lentiviral particles expressing CIKS shRNA (MOI 0.5) for 48 hrs, treated with HG (25 mM) for 12 h, then incubated for 1 h with Calcein AM-loaded THP-1 cells. Endothelial-monocyte adhesion was quantified by measuring fluorescence at excitation and emission wavelengths of 485 and 535 nm. Wells containing HAEC without THP-1 cells served as blanks. *P < 0.001 vs. normal glucose (NG)-treated shRNA-infected cells (n=12), †P < 0.05 vs. HG + copGFP. B, CIKS knockdown in HAEC was confirmed by RT-qPCR (upper panel; n=6) and immunoblotting (lower panel; n=3). *P < 0.01 vs. copGFP. C, CIKS knockdown reverses HG-induced suppression of HAEC migration. HAEC were plated at 70,000 cells/well in a 12-well plate, infected with lentiviral CIKS shRNA (MOI 0.5 for 48 h), and scratched once with a sterile 1 ml pipette tip. The cells were then washed twice with complete media, incubated with HG for an additional 24 h, and photographed at 50X magnification. The width of the gap after 24 h was measured and subtracted from that at 0 h to quantify the distance the cells migrated (representative photomicrographs are shown). The experiments were repeated three times, and the results are summarized on the right. *P < at least 0.05 vs. NG, †P < 0.05 vs. HG + copGFP (n=3).
Fig. 2
Fig. 2. High glucose enhances CIKS expression via increased transcription
A, HG induces CIKS mRNA expression. At 70% confluency, the complete medium was replaced with EBM-2 (without supplements) for 2h, and then incubated for the indicated time periods in the presence of 25 mM D-glucose. CIKS mRNA was analyzed by RT-qPCR, and 18S served as an invariant control. *P < at least 0.01 vs. NG (n=6). B, HG induces CIKS protein expression. HAEC treated as in A were analyzed for CIKS protein expression by immunoblotting. Actin served as a loading control (n=3). C, HG induces CIKS expression via increased transcription. HAEC were treated with HG with actinomycin D (ActD) or cycloheximide (CHX) for 30 min, and analyzed for CIKS mRNA expression by RT-qPCR. *P < at least 0.01, †P < 0.01 vs. NG (n=6). D, E, HG stimulates CIKS promoter-dependent reporter gene activation via IRF, c/EBP and AP-1. HAEC were transfected with a reporter vector containing a 200-bp fragment of the 5′-flanking region of the human CIKS gene (3 g for 24 h) with and without mutations (D). pGL3-Basic served as a vector control. Cells were co-transfected with the Renilla luciferase vector (100 ng). Following transfection, cells were treated with HG for 12 h and harvested for the dual-luciferase assay. Firefly luciferase data were normalized to that of corresponding Renilla luciferase activity. E, *P < at least 0.001 vs. NG, †P < at least 0.05 vs. HG, ††P < 0.001 vs. HG (n=12).
Fig. 3
Fig. 3. High glucose-induced CIKS expression is ROS dependent
A, HAEC expresses relatively more Nox4 than Nox1 and Nox2 under basal conditions. DNA-free total RNA from HAEC was analyzed for Nox1, 2 and 4 by RT-PCR (n=3). B, C, HG induces ROS generation. Cells were treated with NAC (5 mM for 1 h), DPI (10 mM in DMSO for 1 h) or infected with Ad.siNox4 (MOI 100 for 24 h) prior to HG addition. Ad.siGFP served as a control. Intracellular ROS levels following HG treatment were determined by oxidation of the cell-permeable, redox-sensitive fluorophore DCFH-DA into fluorescent DCF (B; knockdown of Nox4 by immunoblotting is shown on the right) and by lucigenin-enhanced chemiluminescence (C). C, *P < at least 0.01 vs. NG, †P < 0.01 vs. HG (n=6). D, E, F, HG-induced CIKS expression is dependent on DPI-inhibitable Nox4-dependent ROS generation. HAEC treated with DPI (C), NAC (D), or infected with Ad.siNox4 (E) were treated with HG (25 mM for 2 h), and analyzed for CIKS expression by immunoblotting using whole cell lysates. Densitometric analysis of three independent experiments is summarized on the right (D) or in lower panels (E, F). D, E, F, *P < 0.01 vs. NG, †P < 0.05 vs. HG.
Fig. 4
Fig. 4. CIKS mediates high glucose-induced ICAM-1 and VCAM-1 expression
. A, B, HG induces ICAM-1 expression. At 70% confluency, the complete medium on HAEC was replaced with EBM-2 (without supplements) for 2h, incubated with HG for the indicated time periods, and analyzed for ICAM-1 protein by immunoblotting (A; n=3) and mRNA expression by RT-qPCR (B). B, *P < at least 0.05 vs. NG. C, D, HG-induced ICAM-1 expression is CIKS dependent. HAEC infected with lentiviral particles expressing CIKS shRNA (MOI 0.5 for 48 h) were treated with HG and analyzed for ICAM-1 protein (C; n=3) and mRNA (12 h; D) expression as in A and B. D, *P < at least 0.01 vs. NG, P < 0.01 vs. HG + copGFP (n=6). E, F, HG induces VCAM-1 expression. HAEC incubated with HG as in A and B were analyzed for VCAM-1 protein (E; n=3) and mRNA expression (F). F, *P < at least 0.05 vs. NG (n=6). G, H, HG-induced VCAM-1 expression is CIKS dependent. HAEC treated as in C and D were analyzed for VCAM-1 protein (G; n=3) and mRNA (12 h; H) expression. H, *P < at least 0.01 vs. NG, P < 0.01 vs. HG + copGFP (n=6).
Fig. 5
Fig. 5. High glucose induces ICAM-1 and VCAM-1 expressions via IKK, p65, JNK, and c-Jun
A, HG induces ICAM-1 expression via IKK, p65, JNK, and c-Jun. HAEC infected with lentiviral particles expressing IKKβ, IKKγ, p65, JNK, or c-Jun shRNA (MOI 0.5 for 48 h) were treated with HG for 12 h and then analyzed for ICAM-1 (A) or VCAM-1 (B) mRNA (12 h) expression by RT-qPCR. Knockdown of respective proteins was confirmed by immunoblotting, and are shown in C. A, B, *P < at least 0.01 vs. NG, †P < at least 0.001 (n=12).
Fig. 6
Fig. 6. CIKS mediates high glucose-induced NF-κB activation
A, HG induces time dependent IκBα phosphorylation. At 70% confluency, the complete medium on HAEC was replaced with EBM-2 (without supplements) for 2h, incubated with HG for the indicated time periods, and analyzed for phospho-IκBα (Ser32/36) protein levels by immunoblotting. Densitometric analysis from three independent experiments is summarized in the lower panel. *P < at least 0.05 vs. NG. B, HG induces IκBα degradation. HAEC treated as in A were analyzed for total IκBα levels by immunoblotting. Densitometric analysis from three independent experiments is summarized in the lower panel. *P < at least 0.05 vs. NG. C, HG promotes p65 nuclear translocation. HAEC treated as in A were analyzed for p65 levels in nuclear protein extracts. Lamin B served as a loading and purity control. Densitometric analysis from three independent experiments is summarized in the lower panel. *P < at least 0.05 vs. NG. D, CIKS knockdown blunts HG-induced IκBα phosphorylation and IκBα degradation. HAEC infected with lentiviral particles expressing CIKS shRNA (MOI 0.5 for 48 h) were treated with HG (1 h) and analyzed for phospho-IκBα (Ser32/36) and total IκBα levels by immunoblotting (n=3). E, CIKS knockdown blunts basal and HG-induced p65 nuclear translocation. HAEC treated with HG (1 h) as in D were analyzed for nuclear p65 levels by immunoblotting (n=3).
Fig. 7
Fig. 7. CIKS mediates high glucose-induced AP-1 activation
A, HG induces time dependent JNK activation. At 70% confluency, the complete medium on HAEC was replaced with EBM-2 (without supplements) for 2h, incubated with HG for the indicated time periods, and analyzed for phospho-JNK (Thr183/185) levels by immunoblotting (n=3). B, HG induces c-Jun phosphorylation. HAEC treated as in A were analyzed for nuclear phospho-c-Jun (Ser73) levels by immunoblotting (n=3). Lamin B served as a loading and purity control. C, JNK knockdown blunts HG-mediated c-Jun phosphorylation. HAEC infected with lentiviral particles expressing JNK shRNA (MOI 0.5 for 48 h) were treated with HG (1 h) and analyzed for nuclear phospho-c-Jun levels by immunoblotting (n=3). D, CIKS knockdown blunts HG-induced JNK activation. HAEC infected with lentiviral particles expressing CIKS shRNA (MOI 0.5 for 48 h) were treated with HG (1 h) and analyzed for phospho-JNK levels by immunoblotting (n=3). E, HG increases CIKS physical association with JNK. HAEC treated with HG for 15 min were analyzed for CIKS/JNK binding by immunoprecipitation/immunoblot (IP/IB) using whole cell lysates (n=3). F, HG increases JNK physical association with IKKγ. HAEC treated as in E were analyzed for JNK/IKKγ binding by IP/IB using whole cell lysates (n=3). G, IKKγ knockdown blunts HG-induced JNK activation. HAEC infected with lentiviral particles expressing IKKγ shRNA (MOI 0.5 for 48 h) were treated with HG (1 h) and analyzed for phospho-JNK levels by immunoblotting (n=3). A, B, C, D and G, densitometric analysis of three independent experiments is summarized in respective lower panels. *P < at least 0.01 vs. NG, †P < 0.05 vs. HG.
Fig. 8
Fig. 8. CIKS mediates high glucose-induced cytokine and chemokine expression
HAEC infected with lentiviral particles expressing CIKS shRNA (MOI 0.5 for 48 h) were treated with HG for 4 h, and analyzed for IL-6 (A), TNF-α (B), MCP-1 (C) and IL-8 (D) mRNA expression by RT-qPCR. *P < at least 0.01 vs. NG, †P < at least 0.05 vs. HG or HG + copGFP (n=6).
Fig. 9
Fig. 9. AGE-HSA, oxLDL and AOPPs-HSA induce CIKS expression via Nox4 and ROS
A, AGE-HSA (left), oxLDL (middle) and AOPPs-HSA (right) induce CIKS expression. At 70% confluency, the complete medium on HAEC was replaced with EBM-2 (without supplements) for 2h, incubated with 50 μg/ml AGE-HSA, oxLDL, or AOPPs-HSA, and then analyzed for CIKS protein expression by immunoblotting. Results from three independent experiments are summarized in respective lower panels. *P < 0.05 vs. respective unmodified proteins, †P<0.05 vs. respective modified proteins (n=3). B, AGE-HSA, oxLDL and AOPPs-HSA induce CIKS expression via Nox4. HAEC were treated with DPI (10 μM in DMSO for 30 min) or infected with Ad.siNox4 (MOI 100 for 24 h) prior to AGE-HSA ((left; 2 h), oxLDL (middle; 2 h) and AOPPs-HSA (right; 4 h) addition. CIKS expression was analyzed by immunoblotting as in A. Results from three independent experiments are summarized in respective lower panels. *P < 0.05 vs. respective unmodified proteins, †P<0.05 vs. respective modified proteins (n=3).
Fig. 10
Fig. 10. CIKS mediates AGE-HSA, oxLDL and AOPPs-HSA induced endothelial-monocyte adhesion
A, AGE-HSA and oxLDL induce adhesion molecule expression. HAEC were treated with AGE-HSA or oxLDL as in A, but for 4 h, were analyzed for ICAM-1 and VCAM-1 expression by immunoblotting. B, AGE-HSA and oxLDL induce adhesion molecule expression via CIKS. HAEC infected with lentiviral particles expressing CIKS shRNA (MOI 0.5 for 48 h) were treated with AGE-HSA (left) or oxLDL (right) for 4 h, and then analyzed for ICAM-1 and VCAM-1 expression by immunoblotting. C, AOPPs-HSA induces adhesion molecule expression via CIKS. HAEC infected with lentiviral particles expressing CIKS shRNA (MOI 0.5 for 48 h) were incubated with AOPPs-HSA for 4 h, and then analyzed for ICAM-1 and VCAM-1 expression by immunoblotting. A, B, C, Results from three independent experiments are summarized in respective lower panels. *P < 0.05 vs. respective unmodified proteins, †P < 0.05 vs. respective modified proteins (n=3). D, AGE-HSA, oxLDL and AOPPs-HSA induce endothelial-monocyte adhesion via CIKS. HAEC were infected with lentiviral particles expressing CIKS shRNA (MOI 0.5 for 48 h) were treated with AGE-HSA, oxLDL and AOPPs-HSA for 4 h. Labeled THP-1 cells were then added, incubated further at 37°C for 1 h, and analyzed for endothelial-monocyte adhesion as in Fig. 1A. *P < 0.001 vs. respective controls, †P < at least 0.01 vs. respective treated groups (n=12).
Fig. 11
Fig. 11. CIKS expression is enhanced in aortas of streptozotocin (STZ)-induced type 1 diabetic mice
A, Blood glucose levels are increased following STZ administration. Male C57Bl/6 mice were administered once daily for 4 days with STZ in sodium citrate buffer (60 mg/kg, IP). The control group received sodium citrate buffer alone. Blood glucose levels were quantified at 3, 5, 10, and 17 days post-STZ. *P < at least 0.05 vs. control (n=4/group). B, DPI-inhibitable ROS is increased in aortas of STZ-induced type 1 diabetic mice. ROS production was measured by the lucigenin-enhanced chemiluminescence assay using aortic homogenates from the indicated groups. The reaction mixture contained 100 μM NADPH. Experiments were also performed in the presence of DPI (10 μM in DMSO). *P < 0.05 vs. saline (n=4/group). C, CIKS protein expression is enhanced in aortas of STZ-treated mice. Aortas from mice described in A were analyzed for CIKS expression by immunoblotting. Densitometric analysis of the immuno-reactive bands is summarized in the lower panel. *P < 0.05 vs. control (n=3/group). D, CIKS, adhesion molecule and IL-6 mRNA expression are increased in aortas from STZ-treated mice. Aortas from mice described in A were analyzed for CIKS, ICAM-1, VCAM-1 and IL-6 mRNA by RT-qPCR. *P < at least 0.05 vs. control (n=4/group).
Fig. 12
Fig. 12. CIKS expression is enhanced in aortas of autoimmune type 1 diabetes-prone Akita and NOD mice
A, B, C, Blood glucose, DPI-inhibitable ROS generation and CIKS protein expression are increased in Akita mice. A, Blood glucose levels were analyzed at 10 weeks of age. *P < 0.01 vs. control (C; n=4/group). B, ROS generation was analyzed by the lucigenin-enhanced chemiluminescence assay using aortic homogenates from the indicated groups. The reaction mixture contained 100 μM NADPH. Experiments were also performed in the presence of DPI (10 μM in DMSO). *P < 0.05 vs. control (C), †P < 0.05 vs. DMSO (n=4/group). C, CIKS expression was analyzed in cleared aortic homogenates by immunoblotting. D, E, F, Blood glucose, DPI-inhibitable ROS generation and CIKS protein expression are increased in 18 week-old female NOD mice. Age-matched insulitis-resistant diabetes-free female NOR mice served as controls. Blood glucose levels (D), ROS generation (E), and CIKS protein expression (F) were analyzed as in A, B and C, respectively. D, *P < 0.05 vs. NOR control (n=4/group). E, *P < 0.05 vs. NOR, †P < 0.05 vs. DMSO (n=4/group). G, Schema showing that CIKS is a critical mediator of high glucose, AGEs, oxLDL and AOPPs induced NF-κB and AP-1 dependent cytokine, chemokine and adhesion molecule expression and endothelial dysfunction.

Similar articles

Cited by

References

    1. Diabetes Care. 2008;31(Suppl 1):S55–60. - PubMed
    1. Collier A, Small M. Br J Hosp Med. 1991;45(1):38–40. - PubMed
    1. Kalousova M, Skrha J, Zima T. Physiol Res. 2002;51(6):597–604. - PubMed
    1. Martin-Gallan P, Carrascosa A, Gussinye M, Dominguez C. Free Radic Biol Med. 2003;34(12):1563–1574. - PubMed
    1. Boullier A, Bird DA, Chang MK, Dennis EA, Friedman P, Gillotre-Taylor K, Horkko S, Palinski W, Quehenberger O, Shaw P, Steinberg D, Terpstra V, Witztum JL. Ann N Y Acad Sci. 2001;947:214–222. discussion 222-213. - PubMed

Publication types

MeSH terms