Review
. 2012 Oct;3(10):1068-111.
doi: 10.18632/oncotarget.659.

Ras/Raf/MEK/ERK and PI3K/PTEN/Akt/mTOR cascade inhibitors: how mutations can result in therapy resistance and how to overcome resistance

Affiliations
Review

Ras/Raf/MEK/ERK and PI3K/PTEN/Akt/mTOR cascade inhibitors: how mutations can result in therapy resistance and how to overcome resistance

James A McCubrey et al. Oncotarget. 2012 Oct.

Abstract

The Ras/Raf/MEK/ERK and PI3K/PTEN/Akt/mTOR cascades are often activated by genetic alterations in upstream signaling molecules such as receptor tyrosine kinases (RTK). Targeting these pathways is often complex and can result in pathway activation depending on the presence of upstream mutations (e.g., Raf inhibitors induce Raf activation in cells with wild type (WT) RAF in the presence of mutant, activated RAS) and rapamycin can induce Akt activation. Targeting with inhibitors directed at two constituents of the same pathway or two different signaling pathways may be a more effective approach. This review will first evaluate potential uses of Raf, MEK, PI3K, Akt and mTOR inhibitors that have been investigated in pre-clinical and clinical investigations and then discuss how cancers can become insensitive to various inhibitors and potential strategies to overcome this resistance.


Figures
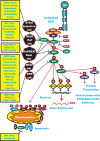
Figure 1
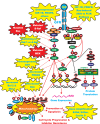
Figure 1. Overview of the Ras/Raf/MEK/ERK Cascade and Small Molecule Inhibitors Used for Targeting this Pathway
Activation of this pathway can occur by mutations in upstream growth factor receptors (GFR) or by stimulation by the appropriate growth factors (GF). In addition, mutations can occur in intrinsic members of the pathway (RAS RAF, MEK1 or the tumor suppressor Neurofibromin (NF1). GFR and GR are indicated in blue. Kinases are indicated in green ovals. Coupling molecules are indicated by orange ovals. The Ras molecule is indicated by a purple oval. Transcription factors are indicated by yellow diamonds. Sites where NF1, protein phosphatase 2A (PP2A) Raf kinase inhibitory protein (RKIP), kinase suppressor of Ras (KSR) interact with this pathway are on the right hand side of the Ras/Raf/MEK/ERK pathway. NF1, PP2A and RKIP are depicted in black rectangles as they normally serve to dampen the activity of this pathway. Molecules such as Mcl-1 which are anti-apoptotic and phosphorylated by ERK and Akt are indicated by blue ovals, other anti-apoptotic molecule are also indicated by blue ovals. Pro-apoptotic molecules are indicated by black ovals. Red arrows indicate activating events in pathways. Sites where various small molecule inhibitors function are in black octagons on the left hand side of the pathway. Representative inhibitors are listed in yellow boxes next to the octagons. Red arrows indicate activating events in pathways. Black arrows indicating inactivating events in pathway. Activating phosphorylation events are depicted in red circles with Ps with a black outlined circle. Inactivating phosphorylation events are depicted in black circles with Ps with a red outlined circle.
Figure 2
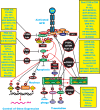
Figure 2. Sites of Mutations which can Result in Resistance to Raf and MEK Inhibitors
Sites of mutation which result in sensitivity to Raf and MEK inhibitors are indicated in red irregular circles. The same color scheme present in Figure 1 for other signaling molecules is continuted in this figure. Signaling induced by mutations is indicated by red dashed lines. Secondary mutation/events which result in inhibitor resistance are depicted in yellow irregular circle. Signaling induced by mutations is indicated by red dashed lines.
Figure 3
Figure 3. Overview of the PI3K/Akt/mTOR Cascade and Small Molecule Inhibitors Used for Targeting this Pathway
Activation of this pathway can occur by mutations in upstream growth factor receptors (GFR) or by stimulation by the appropriate GF. In addition mutations can occur in intrinsic members of the pathway (RAS PIK3CA, AKT or the tumor suppressors (NF1, PTEN, TSC1, TSC2). Sites where NF1, PTEN, TSC1, TSC2 are depicted in black rectangles as they normally serve to dampen the activity of this pathway. An activated growth factor receptor is indicated in blue. Ras and Rheb are indicated in dark blue ovals. IRS1, SOS, Shc and Grb2 are indicated in orange ovals. Kinases are indicated in green ovals. The p85 regulatory subunit of PI3K is indicated in a red oval. Phosphatases are indicated in black octagons. NF1, TSC1 and TSC2 are indicated in black squares. PIP2 and PIP3 are indicated in yellow ovals. mTOR interacting proteins which positively regulate mTOR activity are indicated in yellor ovals. mTOR interacting proteins which negatively regulate mTOR activity are indicated in black ovals. Transcription factors activated by either ERK or Akt phosphorylation are indicated in yellow diamonds. The Foxo transcription factor that is inactivated by Akt phosphorylation is indicated by a black diamond. β-catenin is indicated in an orange rectangle. mRNA initiation factors and proteins associated with the ribosome are indicated in purple ovals. mTORC1 phosphorylates the unc-51-like kinase 1 (ULK1) which results in the suppression of autophagy. ULK1 is indicated in a black oval. The mTORC1 inhibitor prevents phosphorylation of ULK1 and autophagy can occur. Sites where various small molecule inhibitors function are in black octagons. Representative inhibitors are listed in boxes in yellow next to the octagons. Red arrows indicate activating events in pathways. Black arrows indicating inactivating events in pathway. Activating phosphorylation events are depicted in red circles with Ps with a black outlined circle. Inactivating phosphorylation events are depicted in black circles with Ps with a red outlined circle.
Figure 4
Figure 4. Sites of Mutation which can Result in Resistance to mTOR Inhibitors
Sites of mutation which result in resistance to mTOR inhibitors are indicated in yellow irregular circles. The same color scheme present in Figures 1, 2 and 3 is continued in this figure.
Figure 5
Figure 5. Rationale for Targeting Both the Ras/Raf/MEK/ERK and Ras/PI3K/PTEN/Akt/mTOR Pathways for Suppressing Inhibitor Resistant Cells
Initial mutations are depicted in red irregular circle. Secondary mutation/events which result in inhibitor resistance are depicted in yellow irregular circle. Potential combination inhibitor therapeutic approaches are indicated in black octagons. The remaining color scenarios are as presented in Figures 1, 2, 3 and 4. Normal activating signaling is indicated in either solid red or solid black lines. Signaling induced by mutations is indicated by red dashed lines.

Similar articles

Cited by

References

    1. Barretina J, Caponigro G, Stransky N, Venkatesan K, Margolin AA, Kim S, Wilson CJ, Lehár J, Kryukov GV, Sonkin D, Reddy A, Liu M, Murray L, Berger MF, Monahan JE, Morais P, et al. The Cancer Cell Line Encyclopedia enables predictive modelling of anticancer drug sensitivity. Nature. 2012;483:603–607. - PMC - PubMed
    1. Garnett MJ, Edelman EJ, Heidorn SJ, Greenman CD, Dastur A, Lau KW, Greninger P, Thompson IR, Luo X, Soares J, Liu Q, Iorio F, Surdez D, Chen L, Milano RJ, Bignell GR, et al. Systematic identification of genomic markers of drug sensitivity in cancer cells. Nature. 2012;483:570–575. - PMC - PubMed
    1. Chappell WH, Steelman LS, Long JM, Kempf RC, Abrams SL, Franklin RA, Bäsecke J, Stivala F, Donia M, Fagone P, Malaponte G, Mazzarino MC, Nicoletti F, Libra M, Maksimovic-Ivanic D, Mijatovic S, et al. Ras/Raf/MEK/ERK and PI3K/PTEN/Akt/mTOR Inhibitors: Rationale and Importance to Inhibiting These Pathways in Human Health. Oncotarget. 2011;2:135–164. - PMC - PubMed
    1. McCubrey JA, Steelman LS, Kempf CR, Chappell W, Abrams SL, Stivala F, Malaponte G, Nicoletti F, Libra M, Bäsecke J, Maksimovic-Ivanic D, Mijatovic S, Montalto G, Cervello M, Cocco L, Martelli AM. Therapeutic resistance resulting from mutations in Raf/MEK/ERK and PI3K/PTEN/Akt/mTOR signaling pathways. J Cell Physiol. 2011;226:2762–2781. - PubMed
    1. Solit DB, Garraway LA, Pratilas CA, Sawai A, Getz G, Basso A, Ye Q, Lobo JM, She Y, Osman I, Golub TR, Sebolt-Leopold J, Sellers WR, Rosen N. BRAF mutation predicts sensitivity to MEK inhibition. Nature. 2006;439:358–362. - PMC - PubMed

Publication types

MeSH terms