. 2012 Nov;19(11):1161-7.
doi: 10.1038/nsmb.2411. Epub 2012 Oct 21.

Multimodal microtubule binding by the Ndc80 kinetochore complex

Affiliations

Multimodal microtubule binding by the Ndc80 kinetochore complex

Gregory M Alushin et al. Nat Struct Mol Biol. 2012 Nov.

Abstract

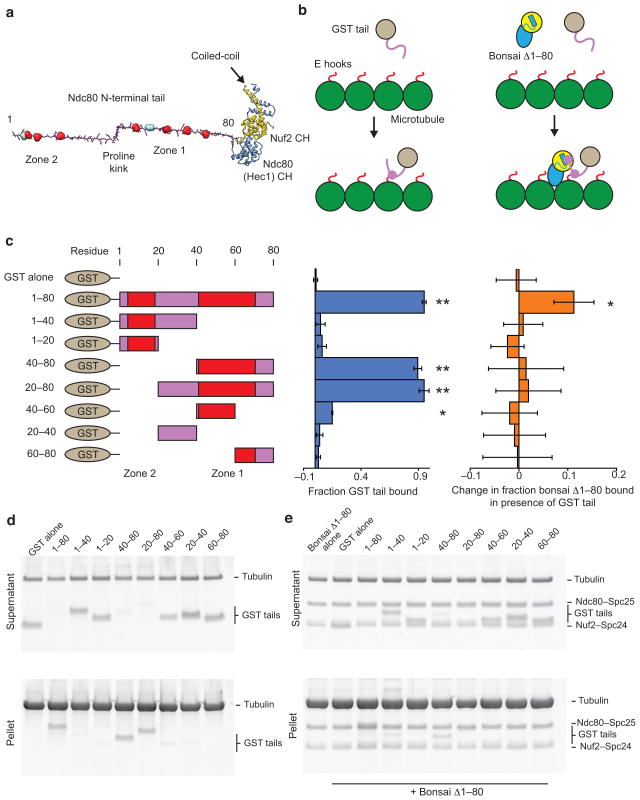
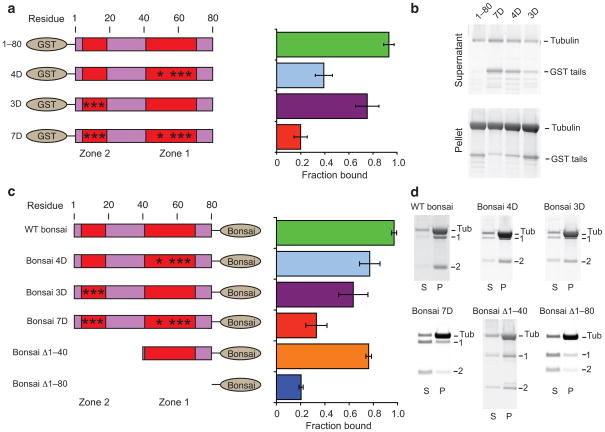
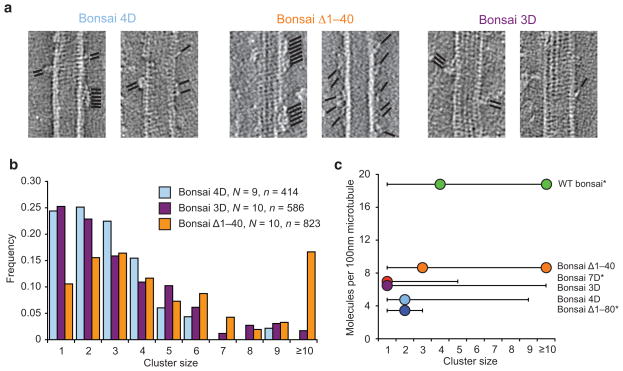
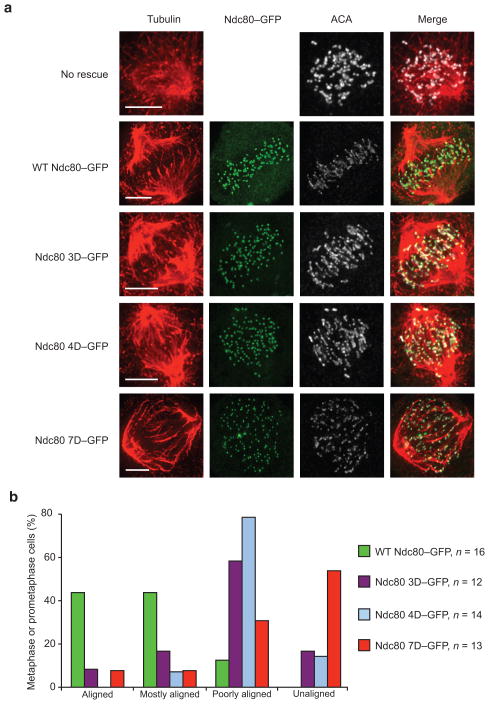
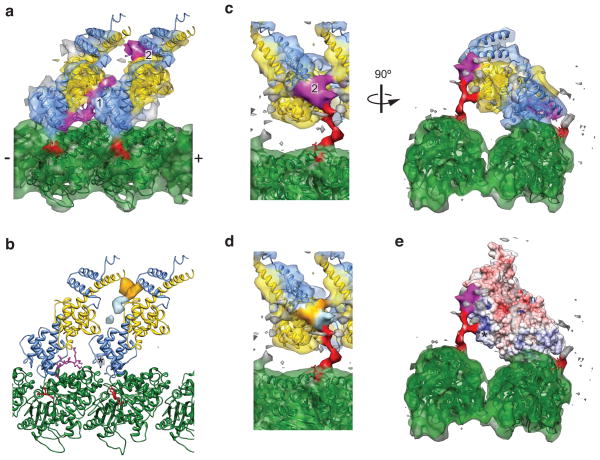
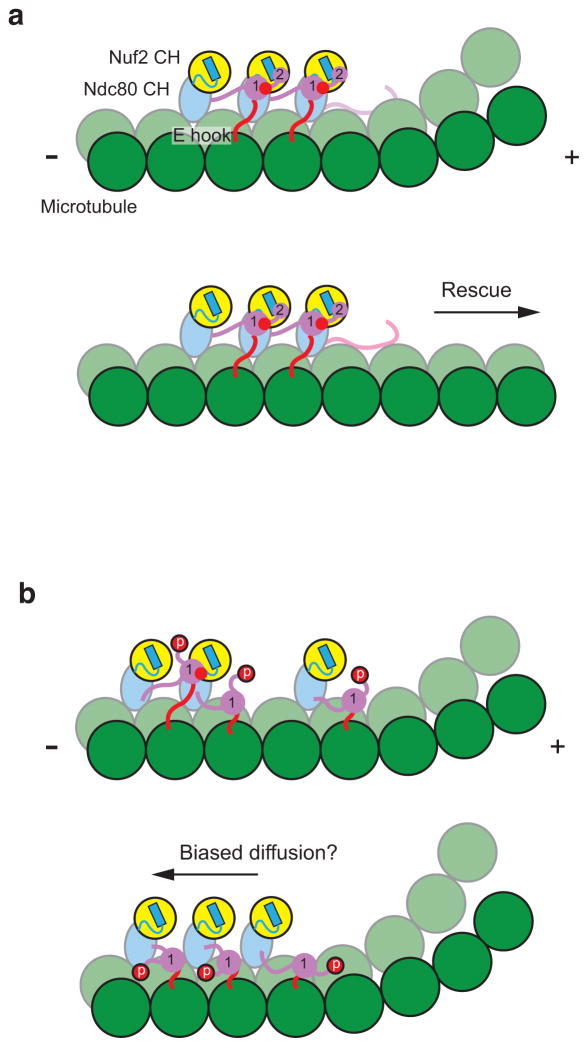
The Ndc80 complex is a key site of kinetochore-microtubule attachment during cell division. The human complex engages microtubules with a globular 'head' formed by tandem calponin-homology domains and an 80-amino-acid unstructured 'tail' that contains sites of phosphoregulation by the Aurora B kinase. Using biochemical, cell biological and electron microscopy analyses, we dissected the roles of the tail in binding of microtubules and mediation of cooperative interactions between Ndc80 complexes. Two segments of the tail that contain Aurora B phosphorylation sites become ordered at interfaces; one with tubulin and the second with an adjacent Ndc80 head on the microtubule surface, forming interactions that are disrupted by phosphorylation. We propose a model in which Ndc80's interaction with either growing or shrinking microtubule ends can be tuned by the phosphorylation state of its tail.


Figures

Figure 1
Figure 1. The Ndc80 tail interacts with both the Ndc80c head and tubulin
(a) Structural model of the Ndc80c’s two-part microtubule binding module. The tail is modeled as an extended polypeptide colored in magenta. Aurora B sites are shown in space-filling representation: red sites were investigated in this study, while teal sites were not (see text). Kinks correspond to the positions of prolines. Ndc80’s CH domain is colored in blue and Nuf2’s in yellow. (b) Cartoons outlining the experiments presented in panels ce. GST is grey, Ndc80 tail, magenta, tubulin, green, tubulin C-terminus (E hook), red. The Ndc80 head is colored and displayed in the same orientation as in A. (c) Left, legend of the constructs tested. Zones of Aurora B sites are indicated in red. Middle, quantification of d. Error bars represent s.d., n = 3. Double asterisk, P < 0.0015, single asterisk, P = 0.008, t-test vs. GST alone control. Right, quantification of e. Error bars represent s.d., n = 4. Single asterisk, P = 0.012, t-test vs. bonsai Δ1–80 alone control. For all co-sedimentation assays n represents technical replicates. (d) SDS-PAGE of microtubule co-sedimentation assays with GST tail constructs. Tubulin, 3 μM, GST tails, 1 μM. (e) SDS-PAGE of microtubule co-sedimentation assays with bonsai Δ1–80 in the presence of GST tail constructs. Tubulin, 3 μM, bonsai Δ1–80, 0.5 μM, GST tails, 1 μM.
Figure 2
Figure 2. Aurora B zones regulate Ndc80c–Ndc80c and Ndc80c–tubulin interactions
(a) Left, legend of the constructs tested in A and B, colored as in Fig. 1. Asterisks represent phosphomimetic S to D mutations. Right, Quantification of b. Error bars represent s.d., n = 3. All mutant constructs showed significantly reduced binding (P < 0.015, t-test) relative to GST 1–80. (b) SDS-PAGE of microtubule co-sedimentation assays with phosphomimetic GST tails. Tubulin, 1.5μM, GST tails, 1μM. (c) Left, legend of the constructs tested in c and d, colored as in a. Right, quantification of d. Error bars represent s.d., n = 3. All mutant constructs showed significantly reduced (P < 0.05, t-test) binding relative to WT bonsai. (d) SDS-PAGE of microtubule co-sedimentation assays with bonsai tail mutants. “Tub”, tubulin, “1”, Ndc80–Spc25, “2”, Nuf2–Spc24. Note that electrophoresis conditions varied between experiments and thus bands show different mobility. Tubulin, 2 μM, bonsai constructs, 0.5 μM.
Figure 3
Figure 3. Zone 2 of Aurora B sites negatively regulates Ndc80c clustering
(a) Representative slices from tomographic reconstructions of microtubules decorated with sub-stoichiometric amounts of the indicated constructs. The positions of Ndc80c molecules are indicated by black lines; all reconstructions featured both clusters and single molecules. Tubulin, 2.5 μM, bonsai constructs, 3.3 μM. (b) Cluster quantification of A. (c) Summary of cluster distributions for all bonsai constructs tested. Dots indicate mode(s), lines indicate range. Asterisks indicate datasets from ref. . See Supplementary Table 1 for pair-wise statistical comparisons between these distributions.
Figure 4
Figure 4. Both Aurora B zones regulate kinetochore–microtubule interactions in vivo
(a) Representative immunofluorescence images of prometaphase or metaphase HeLa cells depleted of endogenous Ndc80 and expressing GFP tagged rescue constructs stained for tubulin, GFP, and ACA. Note that non-rescued cells were not imaged for GFP. (b) Quantification of the chromosome alignment phenotypes for metaphase or prometaphase cells. “Aligned” indicates a tight metaphase plate, “Mostly aligned” indicates only 1–3 pairs of kinetochores off the metaphase plate, “Poorly aligned” indicates greater than 3 pairs of kinetochores off the metaphase plate, “Unaligned” indicates no visible metaphase plate.
Figure 5
Figure 5. Structural analysis of the Ndc80c–microtubule interface
(a) Crystal structures of two bonsai Δ1–80 molecules (PDB 2VE7) and tubulin (PDB 1JFF) docked into the improved cryo-EM density map, colored as in Fig. 1a. Two densities not occupied by the crystal structures (magenta) were interpreted as corresponding to ordered regions of the N-terminal tail. (b) Positive difference density for reconstructions of wild-type bonsai minus either bonsai Δ1–40 (orange), or bonsai 4D (light blue), contoured at 3.5σ. The asterisk indicates a spurious density peak in the bonsai 4D difference map from the processing procedure (see Online Methods). (c) Same as a, but with the cryo-EM map displayed at a lower threshold, where the tubulin E hook (red) is visualized. (d) Same view as c, left panel, colored according to the locations of an ordered portion of residues 1–40 (orange), and the tubulin-binding portion of zone 1 (light blue). (e) Same view as c, right panel, displaying an electrostatic surface potential map of the bonsai Δ1–80 crystal structure, contoured at +/− 10 kT/e. Asterisk indicates the positive patch on the Nuf2 CH domain that interacts with the E hook of tubulin.
Figure 6
Figure 6. Models of Ndc80c interacting with dynamic microtubule ends
(a) Cartoon of fully de-phosphorylated Ndc80c molecules incorporated into a tight cluster on the surface of a dynamic microtubule, colored as in Fig. 1. The interactions formed by zones 1 and 2 of the Ndc80 tail are numbered, and tubulin E hook–Nuf2 CH interactions are depicted as red circles. For simplicity only interactions within the Ndc80c cluster are shown. In this configuration, the cluster can promote both tubulin longitudinal contacts along protofilaments, through its toe–tubulin interactions, and lateral contacts between protofilaments, by interacting with tubulin E hooks from a neighboring protofilament. This network of interactions has a cumulative effect on microtubule stability. (b) Cartoon of Ndc80c phosphorylated in zone 2 but not zone 1. We envision that in this state the complex will remain attached to the MT surface but in the context of smaller and looser clusters. In some cases a weak interaction between Ndc80 complexes may still be maintained via zone 1 (top panel, left), while in other cases all cooperative interactions may be absent (bottom panel). This intermediate phosphorylation state may enhance the mobility of the complex, enabling kinetochore tracking on depolymerizing microtubule ends by a biased diffusion mechanism.

Similar articles

Cited by

References

    1. Cheeseman IM, Chappie JS, Wilson-Kubalek EM, Desai A. The conserved KMN network constitutes the core microtubule-binding site of the kinetochore. Cell. 2006;127:983–97. - PubMed
    1. Wigge PA, Kilmartin JV. The Ndc80p complex from Saccharomyces cerevisiae contains conserved centromere components and has a function in chromosome segregation. J Cell Biol. 2001;152:349–60. - PMC - PubMed
    1. DeLuca JG, Moree B, Hickey JM, Kilmartin JV, Salmon ED. hNUF2 inhibition blocks stable kinetochore–microtubule attachment and induces mitotic cell death in HeLa cells. J Cell Biol. 2002;159:549–55. - PMC - PubMed
    1. McCleland ML, et al. The vertebrate Ndc80 complex contains Spc24 and Spc25 homologs, which are required to establish and maintain kinetochore–microtubule attachment. Curr Biol. 2004;14:131–7. - PubMed
    1. DeLuca JG, et al. Kinetochore microtubule dynamics and attachment stability are regulated by HEC1. Cell. 2006;127:969–82. - PubMed

Publication types