. 2012 Oct;24(10):4205-19.
doi: 10.1105/tpc.112.100263. Epub 2012 Oct 19.

Spatio-temporal cellular dynamics of the Arabidopsis flagellin receptor reveal activation status-dependent endosomal sorting

Affiliations

Spatio-temporal cellular dynamics of the Arabidopsis flagellin receptor reveal activation status-dependent endosomal sorting

Martina Beck et al. Plant Cell. 2012 Oct.

Abstract

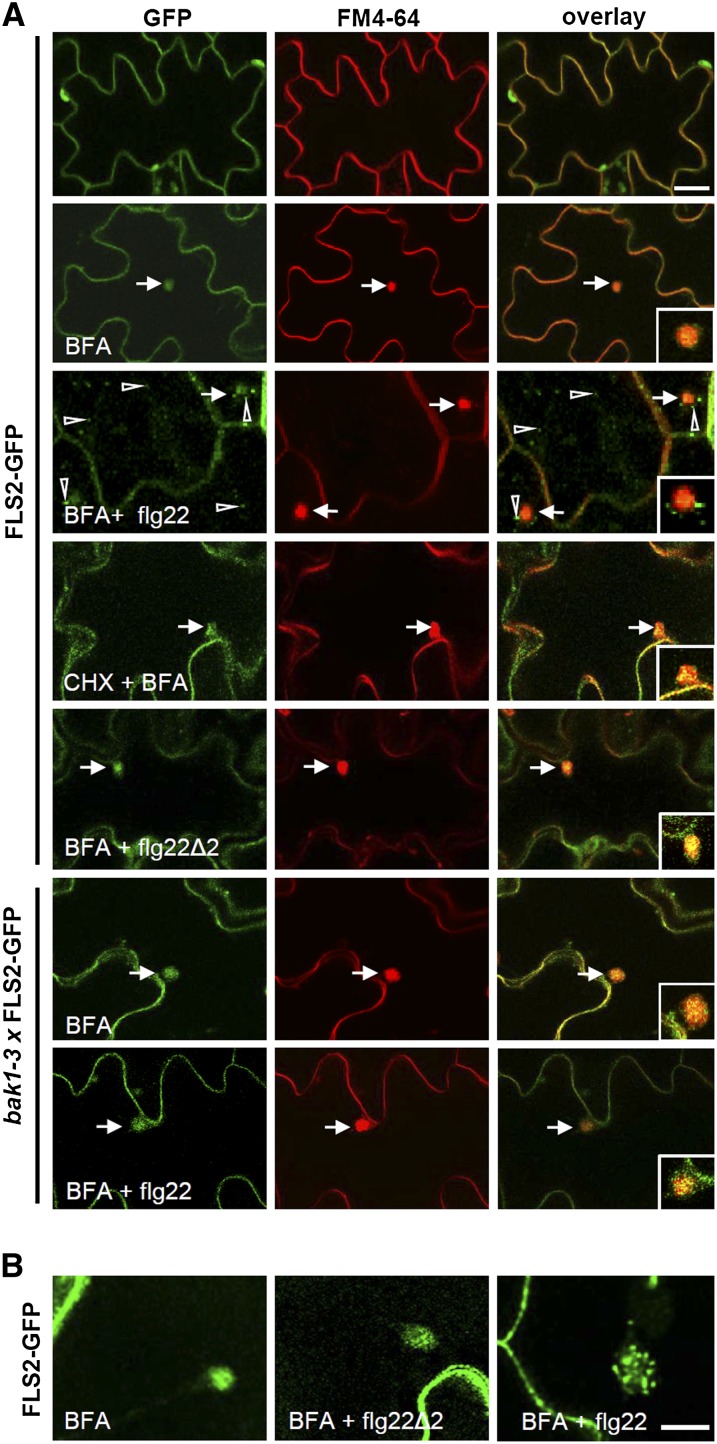
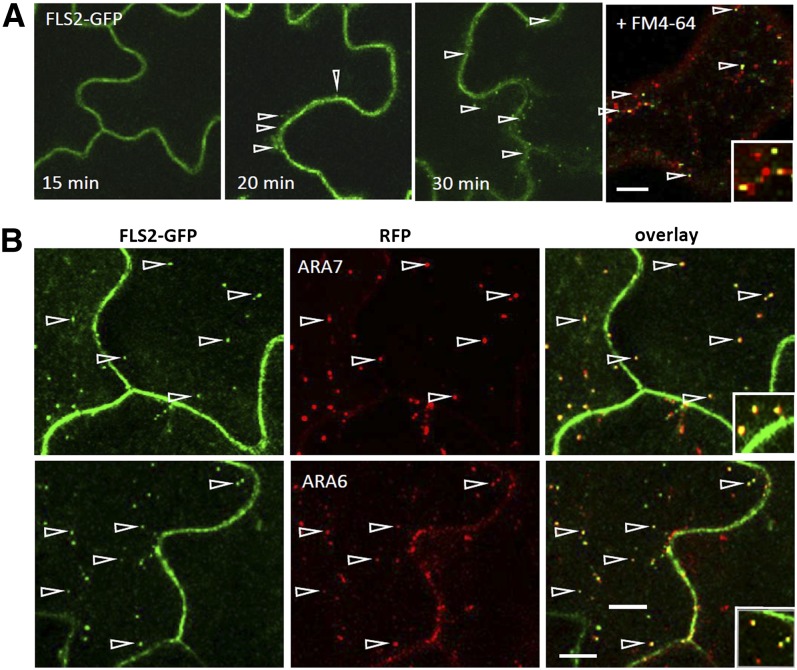
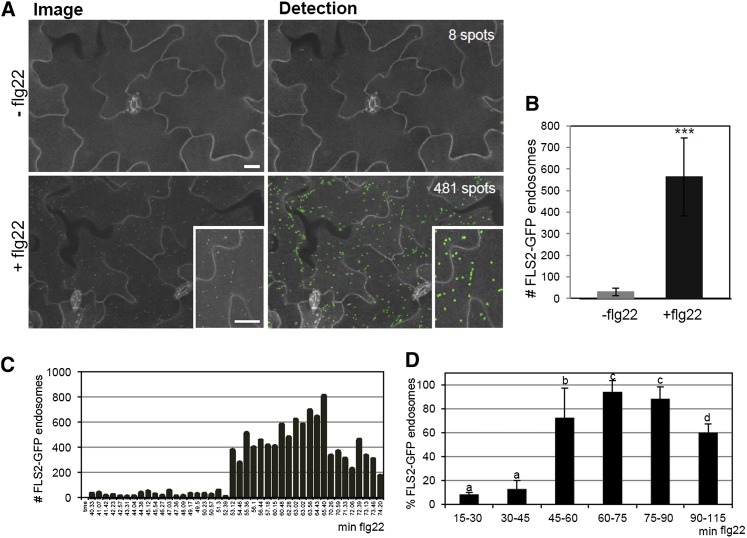
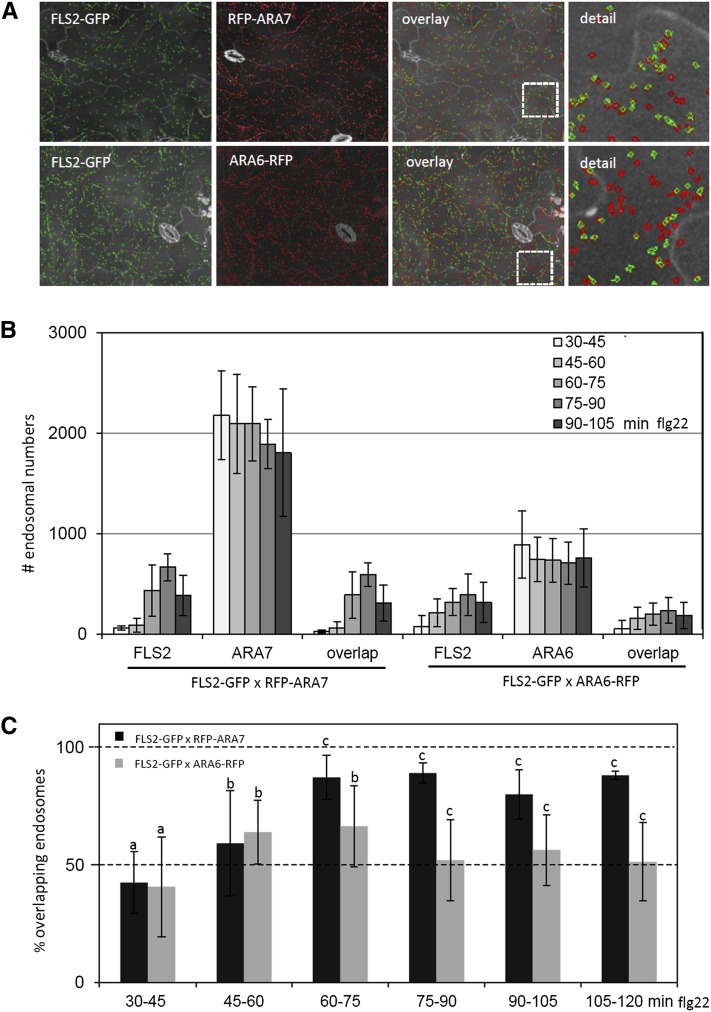
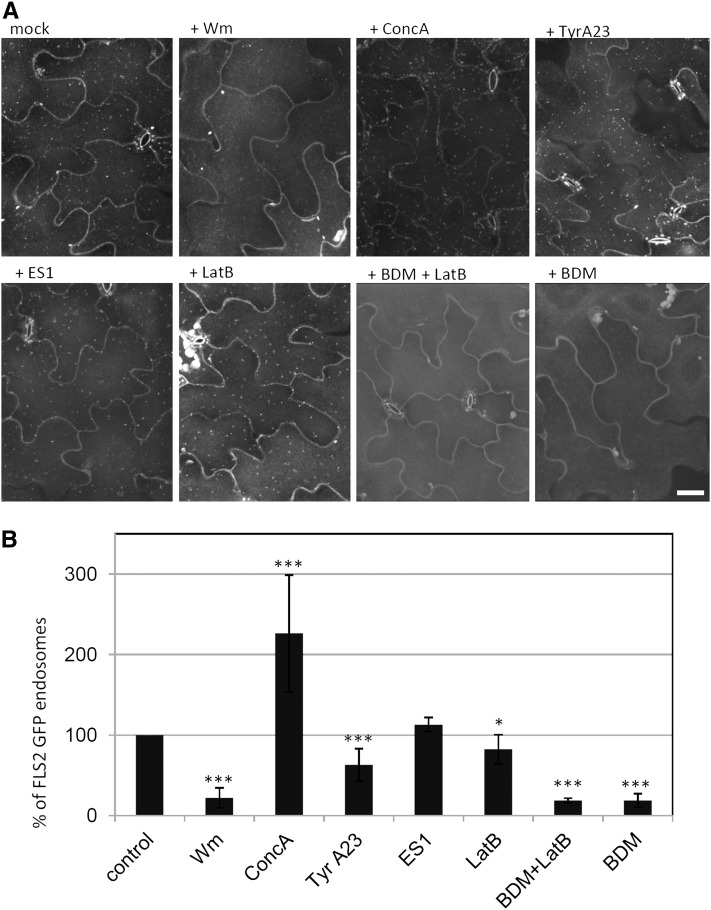
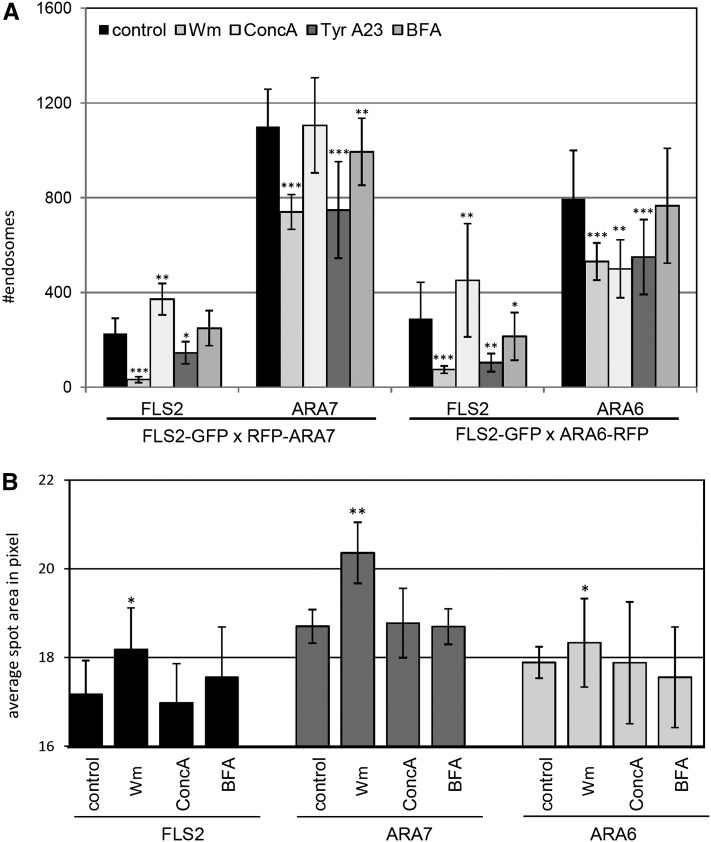
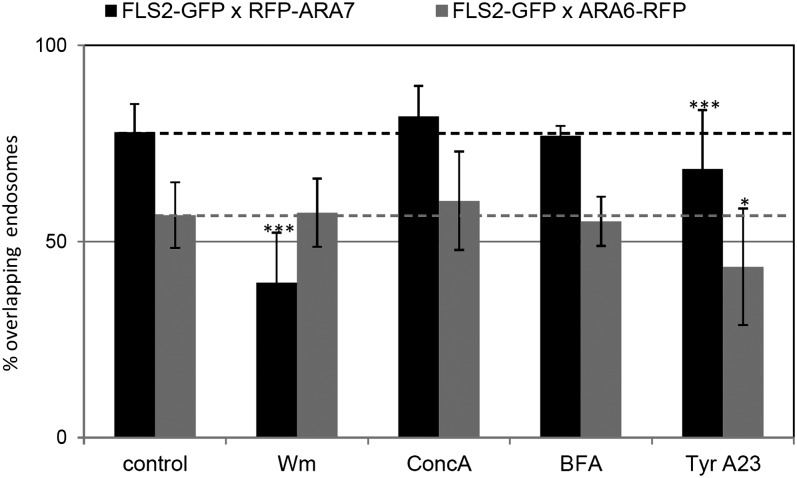
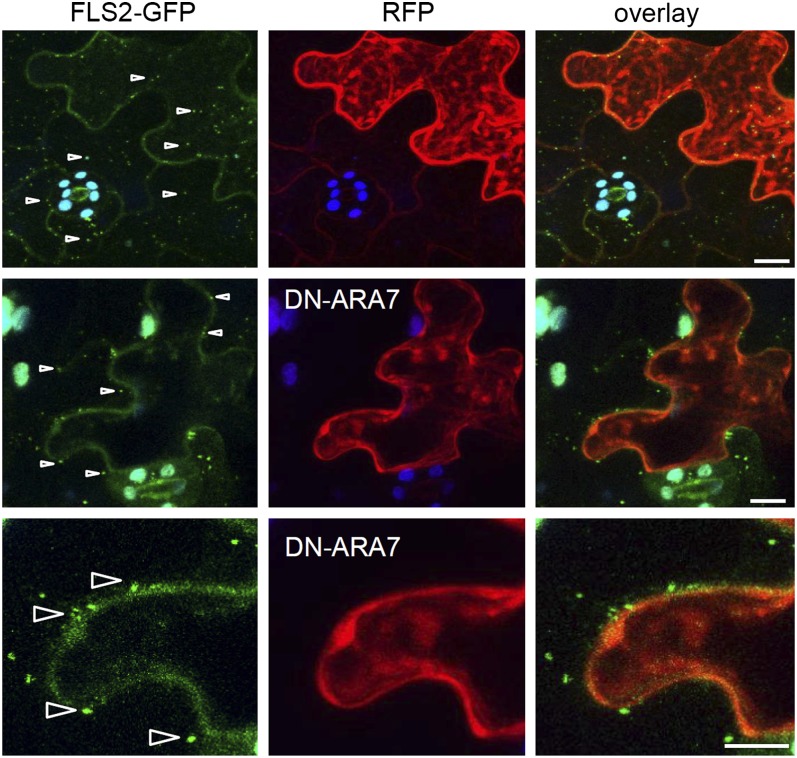
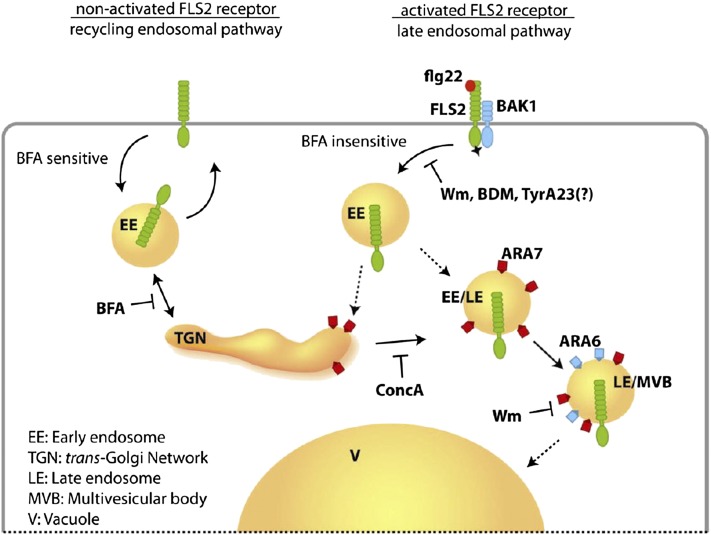
The activity of surface receptors is location specific, dependent upon the dynamic membrane trafficking network and receptor-mediated endocytosis (RME). Therefore, the spatio-temporal dynamics of RME are critical to receptor function. The plasma membrane receptor flagellin sensing2 (FLS2) confers immunity against bacterial infection through perception of flagellin (flg22). Following elicitation, FLS2 is internalized into vesicles. To resolve FLS2 trafficking, we exploited quantitative confocal imaging for colocalization studies and chemical interference. FLS2 localizes to bona fide endosomes via two distinct endocytic trafficking routes depending on its activation status. FLS2 receptors constitutively recycle in a Brefeldin A (BFA)-sensitive manner, while flg22-activated receptors traffic via ARA7/Rab F2b- and ARA6/Rab F1-positive endosomes insensitive to BFA. FLS2 endocytosis required a functional Rab5 GTPase pathway as revealed by dominant-negative ARA7/Rab F2b. Flg22-induced FLS2 endosomal numbers were increased by Concanamycin A treatment but reduced by Wortmannin, indicating that activated FLS2 receptors are targeted to late endosomes. RME inhibitors Tyrphostin A23 and Endosidin 1 altered but did not block induced FLS2 endocytosis. Additional inhibitor studies imply the involvement of the actin-myosin system in FLS2 internalization and trafficking. Altogether, we report a dynamic pattern of subcellular trafficking for FLS2 and reveal a defined framework for ligand-dependent endocytosis of this receptor.


Figures

Figure 1.
Figure 1.
Nonactivated FL2-GFP Recycles between the Plasma Membrane and Endosomal Compartments. Standard confocal micrographs of the indicated Arabidopsis transgenic lines expressing FLS2-GFP show optical sections of cotyledon epidermis. (A) FLS2-GFP subcellular localization in the presence of the indicated chemicals, ligands, and genotypes. Costaining with FM4-64 highlights the plasma membrane and BFA bodies. Arrows indicate BFA bodies, arrowheads FLS2 endosomes; inset images show details of BFA bodies. Bar = 20 µm; bar in inset = 5 µm. (B) Spinning disc confocal images of FLS2-GFP subcellular localization upon BFA treatment show clear differences in BFA formation in the absence and presence of flg22Δ2 or flg22. Bar = 10 µm.
Figure 2.
Figure 2.
FLS2-GFP Differentially Colocalizes to Known Endosomal Markers. Standard confocal micrographs of Arabidopsis transgenic lines expressing FLS2-GFP show optical sections of cotyledon epidermis untreated or treated with flg22. (A) Flg22-induced FLS2-GFP internalization in a time-dependent manner and costaining with the endocytic tracer FM4-64. Arrowheads point at FLS2 endosomes. Bar = 10 µm. (B) FLS2-GFP colocalization with ARA6/Rab F1-RFP and RFP-ARA7/Rab F2b endosomal markers in crossed transgenic lines. Arrowheads point at colocalizing endosomes. FLS2-GFP is shown in green, FM4-64, ARA6/Rab F1-RFP, and RFP-ARA7/Rab F2b in red, and the overlay indicating colocalization in yellow. Inset pictures show details (10 × 10 µm). Bar = 10 µm.
Figure 3.
Figure 3.
Time Dependency of flg22-Induced FLS2-GFP Endocytosis Measured by Quantitative Imaging. (A) High-throughput confocal micrographs of Arabidopsis transgenic lines expressing FLS2-GFP show cross sections of cotyledon epidermis untreated or treated with flg22 (image) and the respective computational spot detection. Inset pictures show details of FLS2-GFP endosome detection. Bars = 30 µm. (B) Quantification of FLS2-GFP endosomal numbers per image area in the absence and presence of flg22. Error bars represent sd; control n = 78, flg22 n = 140 images. Asterisks indicate statistical significance of P value ≤ 0.001 based on Student’s t test analysis. (C) FLS2-GFP endosomal numbers per image area in response to flg22 treatment over time. Example of one experiment; each time point depicts one well (n = 2 to 4 per time point, total analyzed images per plate, n = 155). (D) Percentage of flg22-induced FLS2-GFP endosomes over time. Spot maximum per experiment was set to 100%, and the percentage of spot number per time interval compared with the maximum was calculated; 15 to 30 min, n = 157; 30 to 45 min, n = 250; 45 to 60 min, n = 369; 60 to 75 min, n = 237; 75 to 90 min, n = 202; 90 to 115 min, n = 86 images per different time interval. In total, 1301 images were analyzed; error bars = sd (four biological replicates); a, b, and c represent statistical significance (P value ≤ 0.05) between pairwise tested groups based on Student’s t test. [See online article for color version of this figure.]
Figure 4.
Figure 4.
Flg22-Induced FLS2-GFP Endosomes Colocalize to ARA6/Rab F1– and ARA7/Rab F2b–Positive Compartments in a Time-Dependent Manner. (A) High-throughput confocal micrographs of Arabidopsis FLS2-GFP transgenic lines expressing RFP-ARA7/Rab F2b and ARA6/Rab F1-RFP show computational spot detection of cross sections of the cotyledon epidermis treated with flg22. FLS2-GFP endosomes are shown in green and ARA6/Rab F1-RFP and RFP-ARA7/Rab F2b endosomes are shown in red, in single and overlay images. (B) Quantification of endosomal numbers in percentage of total image area of the FLS2-GFP × RFP-ARA7/Rab F2b and FLS2-GFP × ARA6/Rab F1-RFP lines upon flg22 elicitation over time (FLS2-GFP × RFP-ARA7 in total n = 72, n = 7 to 10 per time point), FLS2-GFP × ARA6-RFP in total n = 125, n = 15 to 22 per time point; error bar represents sd. (C) Percentage of FLS2-GFP, ARA6/Rab F1-RFP, and RFP-ARA7/Rab F2b endosomes over time flg22 treatment (FLS2-GFP × RFP-ARA7 in total n = 72, n = 7 to 10 per time point), FLS2-GFP × ARA6-RFP in total n = 125, n = 15 to 22 per time point; error bar represents sd; a, b, and c represent statistical significance (P value ≤ 0.05) between pairwise tested groups based on Student’s t test.
Figure 5.
Figure 5.
Chemical Interference of flg22-Induced FLS2 Endosomes. (A) High-throughput confocal micrographs of Arabidopsis FLS2-GFP transgenic lines show maximum projections of cotyledon epidermis treated with flg22 for 50 to 60 min and the indicated chemical inhibitors. Bar = 30 µm. (B) Quantification of endosomal numbers in percentage of total image area of flg22-induced FLS2-GFP endosomes in the presence of the indicated chemical inhibitors. In total, 1306 images were analyzed (control n = 616, Wm n = 85, ConcA n = 71, TyrA23 n = 100, ES1 n = 38, LatB n = 154, BDM + LatB n = 105, BDM n = 137); the mean of three biological replicates is depicted; error bars represent sd; asterisks indicate statistical significance of *P value ≤ 0.05, **P value ≤ 0.01, and ***P value ≤ 0.001 based on Student’s t test.
Figure 6.
Figure 6.
Quantification of flg22-Induced FLS2, ARA7/Rab F2b, and ARA6/Rab F1 Endosomes upon Chemical Interference. (A) Percentage of FLS2-GFP, RFP-ARA7/Rab F2b, and ARA6/Rab F1-RFP endosomal numbers per 100% image area upon 30 to 75 min flg22 elicitation and in the presence of the indicated chemical inhibitors. Error bars represent sd; n = 20 to 44 images. (B) Average spot area of FLS2-GFP, ARA6/Rab F1-RFP, and RFP-ARA7/Rab F2b endosomal numbers per image upon 40 to 90 min flg22 elicitation and in the presence of the indicated chemical inhibitors. Error bars represent sd; n = 10 to 20 images; asterisks indicate statistical significance of *P value ≤ 0.05, **P value ≤ 0.01, and ***P value ≤ 0.001 based on Student’s t test.
Figure 7.
Figure 7.
Quantification of flg22-Induced FLS2 Endosomes Colocalizing to ARA7/Rab F2b– and ARA6/Rab F1–Positive Compartments upon Chemical Interference. Percentage of overlap between FLS2-GFP, ARA6/Rab F1-RFP, and RFP-ARA7/Rab F2b endosomal numbers upon 30 to 75 min flg22 and chemical inhibitor treatments. Dashed lines relate to control values. Error bars represent sd; n = 10 to 20 images per time point. In total, between 90 and 120 images were analyzed. Asterisks indicate statistical significance of *P value ≤ 0.05, **P value ≤ 0.01, and ***P value ≤ 0.001 based on Student’s t test.
Figure 8.
Figure 8.
A Functional Rab5 GTPase Pathway Is Required for FLS2-GFP Endocytosis. Standard confocal micrographs of Arabidopsis transgenic lines expressing FLS2-GFP show optical sections of flg22-treated leaf epidermal cells transiently expressing cytosolic RFP or dominant-negative RFP-ARA7/Rab F2b (DN-ARA7) after particle bombardment. RFP signals indicate successful transiently transformed cells. Flg22-induced FLS2-GFP endosomes are detected in RFP-expressing cells but not when DN-ARA7 is present. However, neighboring cells show FLS2-GFP endosomes. Arrowheads point at FLS2-GFP endosomes. FLS2-GFP is shown in green, RFP and RFP-DN-ARA7/Rab F2b in red, and autofluorescence from chloroplasts in blue. Similar results were obtained from eight transformed cells of at least two independent experiments. Bars = 10 µm.
Figure 9.
Figure 9.
Schematic Model of the FLS2 Endocytic Routes. Depending on its activation status, FLS2 enters two distinct endosomal pathways. The nonactivated receptor follows a recycling and BFA-sensitive endosomal pathway. FLS2 receptors activated by its ligand flg22 traffic via a BFA-insensitive pathway and are sequentially transported via ARA7/Rab F2b–and ARA6/Rab F1–positive and ConcA- and Wm-sensitive endosomes to the vacuole. [See online article for color version of this figure.]

References

    1. Banbury D.N., Oakley J.D., Sessions R.B., Banting G. (2003). Tyrphostin A23 inhibits internalization of the transferrin receptor by perturbing the interaction between tyrosine motifs and the medium chain subunit of the AP-2 adaptor complex. J. Biol. Chem. 278: 12022–12028 - PubMed
    1. Bandmann V., Homann U. (2012). Clathrin-independent endocytosis contributes to uptake of glucose into BY-2 protoplasts. Plant J. 70: 578–584 - PubMed
    1. Bauer Z., Gómez-Gómez L., Boller T., Felix G. (2001). Sensitivity of different ecotypes and mutants of Arabidopsis thaliana toward the bacterial elicitor flagellin correlates with the presence of receptor-binding sites. J. Biol. Chem. 276: 45669–45676 - PubMed
    1. Bolte S., Talbot C., Boutte Y., Catrice O., Read N.D., Satiat-Jeunemaitre B. (2004). FM-dyes as experimental probes for dissecting vesicle trafficking in living plant cells. J. Microsc. 214: 159–173 - PubMed
    1. Chen X., Irani N.G., Friml J. (2011). Clathrin-mediated endocytosis: The gateway into plant cells. Curr. Opin. Plant Biol. 14: 674–682 - PubMed

Publication types