

The novel tumor suppressor NOL7 post-transcriptionally regulates thrombospondin-1 expression
- PMID: 23085760
- PMCID: PMC6698137
- DOI: 10.1038/onc.2012.464
The novel tumor suppressor NOL7 post-transcriptionally regulates thrombospondin-1 expression
Abstract
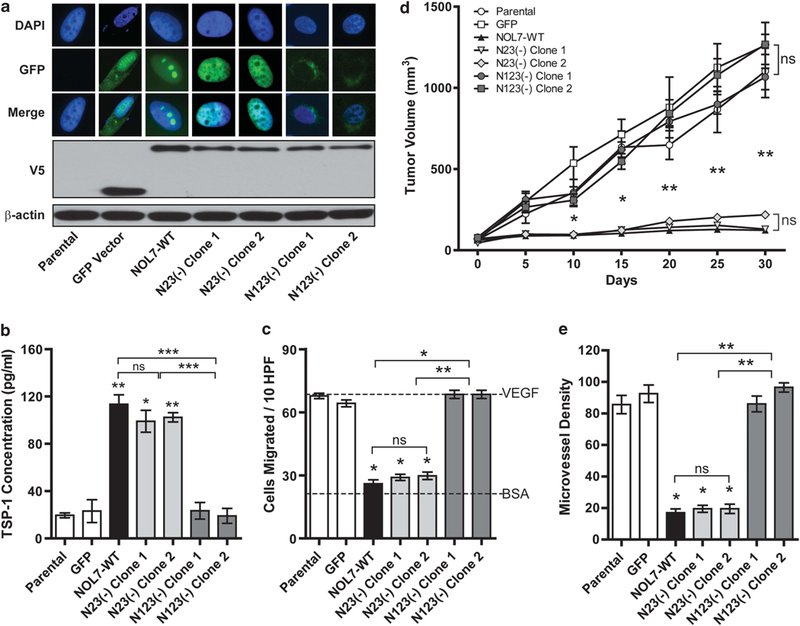
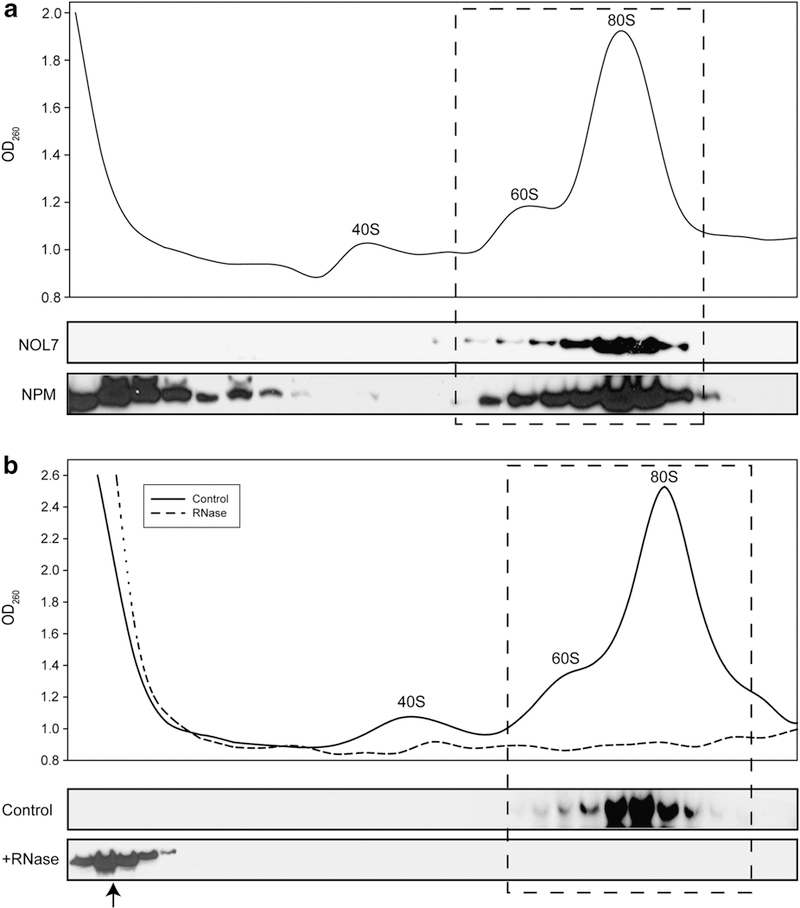
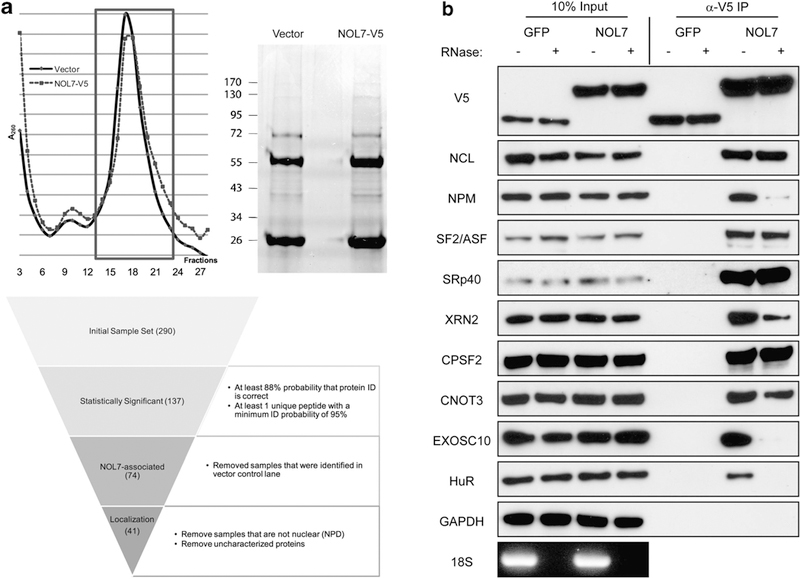
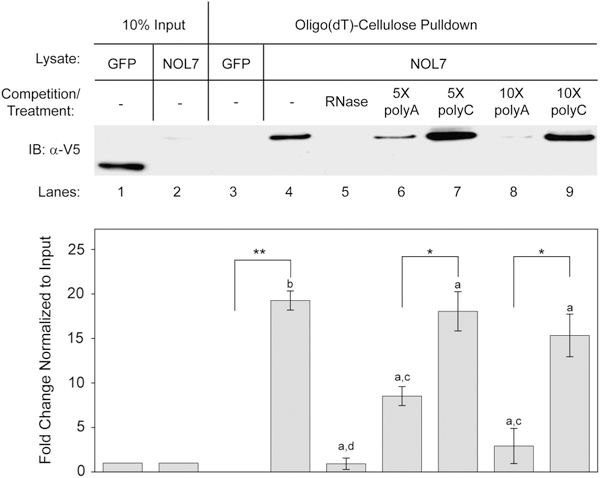
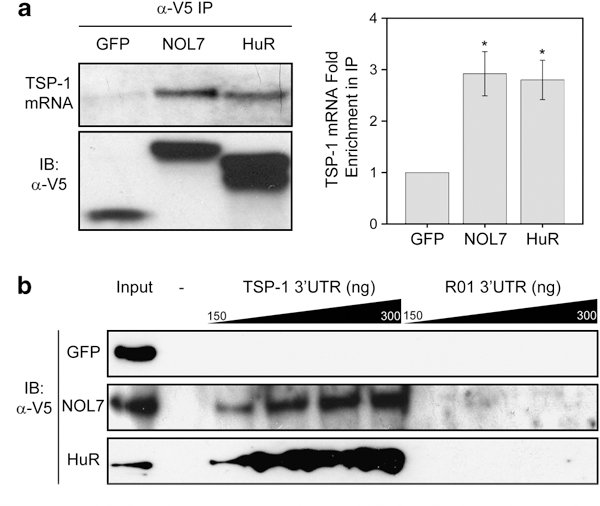
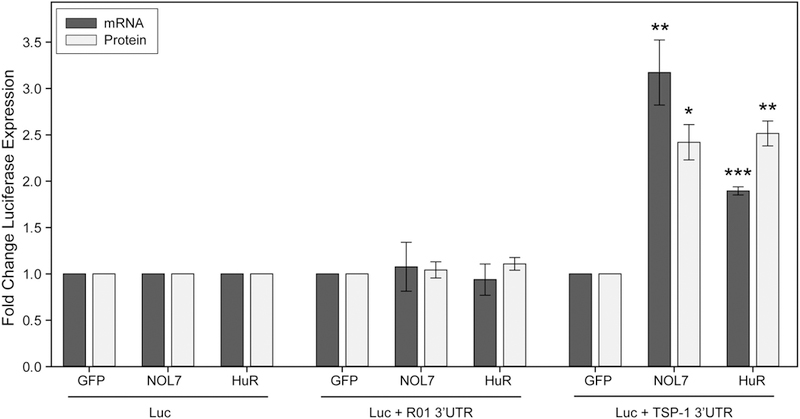
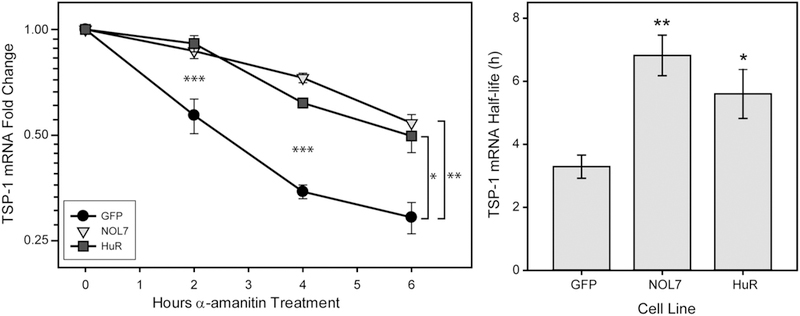
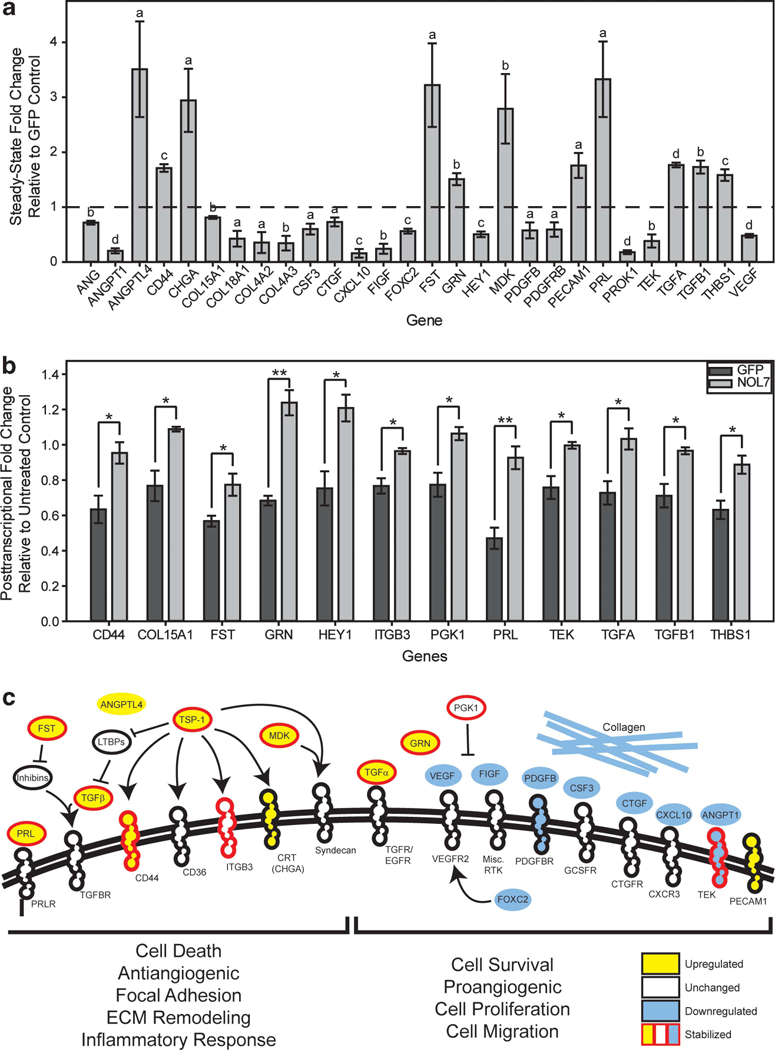
Thrombospondin-1 (TSP-1) is an endogenous inhibitor of angiogenesis whose expression suppresses tumor growth in vivo. Like many angiogenesis-related genes, TSP-1 expression is tightly controlled by various mechanisms, but there is little data regarding the contribution of post-transcriptional processing to this regulation. NOL7 is a novel tumor suppressor that induces an antiangiogenic phenotype and suppresses tumor growth, in part through upregulation of TSP-1. Here we demonstrate that NOL7 is an mRNA-binding protein that must localize to the nucleoplasm to exert its antiangiogenic and tumor suppressive effects. There, it associates with the RNA-processing machinery and specifically interacts with TSP-1 mRNA through its 3'UTR. Reintroduction of NOL7 into SiHa cells increases luciferase expression through interaction with the TSP-1 3'UTR at both the mRNA and protein levels. NOL7 also increases endogenous TSP-1 mRNA half-life. Further, NOL7 post-transcriptional stabilization is observed in a subset of angiogenesis-related mRNAs, suggesting that the stabilization of TSP-1 may be part of a larger novel mechanism. These data demonstrate that NOL7 significantly alters TSP-1 expression and may be a master regulator that coordinates the post-transcriptional expression of key signaling factors critical for the regulation of the angiogenic phenotype.
Conflict of interest statement
CONFLICT OF INTEREST
The authors declare no conflict of interest.
Figures
Similar articles
-
The RB tumor suppressor positively regulates transcription of the anti-angiogenic protein NOL7.Neoplasia. 2012 Dec;14(12):1213-22. doi: 10.1593/neo.121422. Neoplasia. 2012. PMID: 23308053 Free PMC article.
-
Regulation of thrombospondin-1 expression through AU-rich elements in the 3'UTR of the mRNA.Cell Mol Biol Lett. 2011 Mar;16(1):55-68. doi: 10.2478/s11658-010-0037-x. Epub 2010 Dec 15. Cell Mol Biol Lett. 2011. PMID: 21161418 Free PMC article.
-
Rapid insulin-like growth factor-1-induced changes in granulosa cell thrombospondin-1 expression in vitro.J Reprod Dev. 2011 Feb;57(1):76-83. doi: 10.1262/jrd.10-045h. J Reprod Dev. 2011. PMID: 21422735
-
Thrombospondin-1 as an endogenous inhibitor of angiogenesis and tumor growth.J Cell Mol Med. 2002 Jan-Mar;6(1):1-12. doi: 10.1111/j.1582-4934.2002.tb00307.x. J Cell Mol Med. 2002. PMID: 12003665 Free PMC article. Review.
-
Regulation of tumor angiogenesis by thrombospondin-1.Biochim Biophys Acta. 2006 Apr;1765(2):178-88. doi: 10.1016/j.bbcan.2005.11.002. Epub 2005 Dec 21. Biochim Biophys Acta. 2006. PMID: 16406676 Review.
Cited by
-
NOL-7 serves as a potential prognostic-related biomarker for hepatocellular carcinoma.Discov Oncol. 2025 Jan 21;16(1):69. doi: 10.1007/s12672-024-01551-7. Discov Oncol. 2025. PMID: 39836310 Free PMC article.
-
Human nucleolar protein 7 (NOL7) is required for early pre-rRNA accumulation and pre-18S rRNA processing.RNA Biol. 2023 Jan;20(1):257-271. doi: 10.1080/15476286.2023.2217392. RNA Biol. 2023. PMID: 37246770 Free PMC article.
-
Proteome profiling of triple negative breast cancer cells overexpressing NOD1 and NOD2 receptors unveils molecular signatures of malignant cell proliferation.BMC Genomics. 2019 Feb 21;20(1):152. doi: 10.1186/s12864-019-5523-6. BMC Genomics. 2019. PMID: 30791886 Free PMC article.
-
Functions of Thrombospondin-1 in the Tumor Microenvironment.Int J Mol Sci. 2021 Apr 27;22(9):4570. doi: 10.3390/ijms22094570. Int J Mol Sci. 2021. PMID: 33925464 Free PMC article. Review.
-
The RB tumor suppressor positively regulates transcription of the anti-angiogenic protein NOL7.Neoplasia. 2012 Dec;14(12):1213-22. doi: 10.1593/neo.121422. Neoplasia. 2012. PMID: 23308053 Free PMC article.
References
-
- Hanahan D, Weinberg RA. The hallmarks of cancer. Cell 2000; 100: 57–70. - PubMed
-
- Hanahan D, Weinberg RA. Hallmarks of cancer: the next generation. Cell (Research Support, NIH, Extramural Review) 2011; 144: 646–674. - PubMed
-
- Carmeliet P, Jain RK. Angiogenesis in cancer and other diseases. Nature 2000; 407: 249–257. - PubMed
-
- Folkman J Role of angiogenesis in tumor growth and metastasis. Semin Oncol 2002; 29(6 Suppl 16): 15–18. - PubMed
-
- Carmeliet P Angiogenesis in health and disease. Nat Med 2003; 9: 653–660. - PubMed
Publication types
MeSH terms
Substances
Grants and funding
LinkOut - more resources
Full Text Sources
Molecular Biology Databases
Miscellaneous
