. 2013 Sep 12;32(37):4397-405.
doi: 10.1038/onc.2012.461. Epub 2012 Oct 22.

NANOG modulates stemness in human colorectal cancer

Affiliations

NANOG modulates stemness in human colorectal cancer

J Zhang et al. Oncogene. .

Abstract

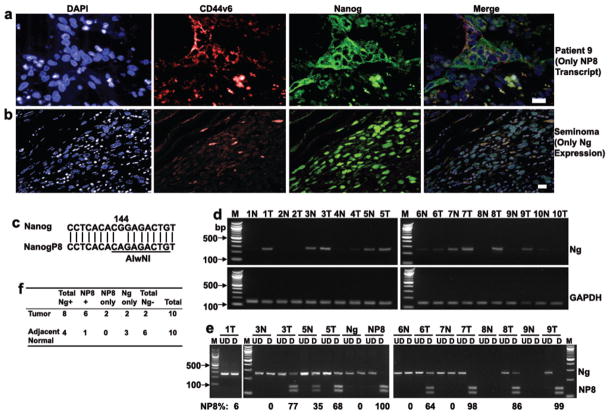
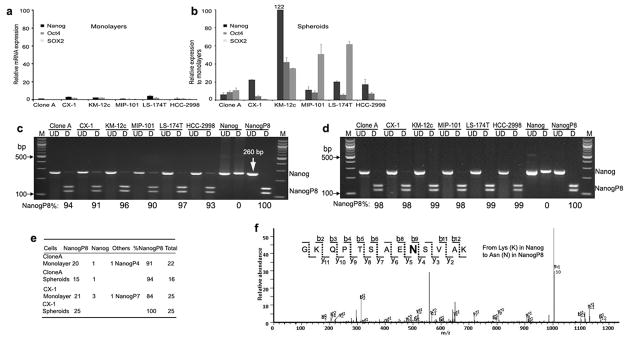
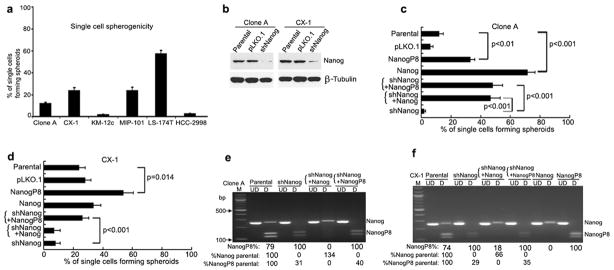
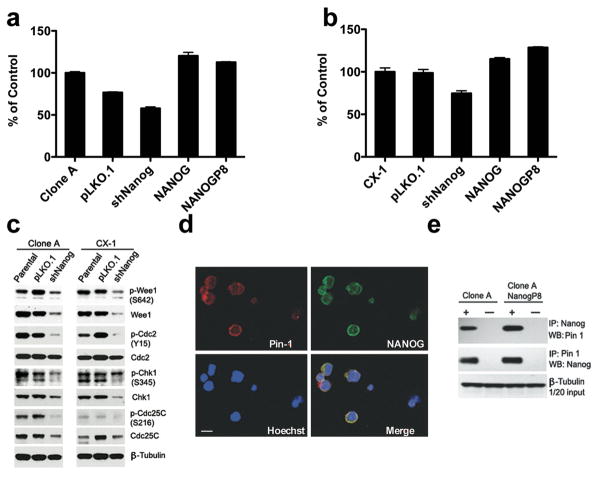
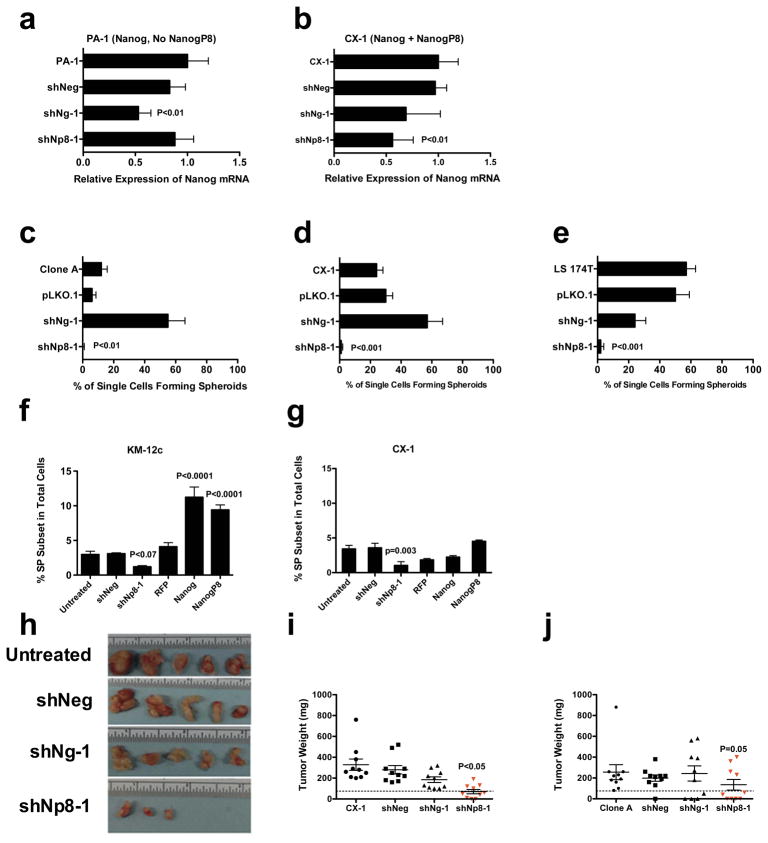
NANOG is a stem cell transcription factor that is essential for embryonic development, reprogramming normal adult cells and malignant transformation and progression. The nearly identical retrogene NANOGP8 is expressed in multiple cancers, but generally not in normal tissues and its function is not well defined. Our postulate is that NANOGP8 directly modulates the stemness of individual human colorectal carcinoma (CRC) cells. Stemness was measured in vitro as the spherogenicity of single CRC cells in serum-free medium and the size of the side population (SP) and in vivo as tumorigenicity and experimental metastatic potential in NOD/SCID mice. We found that 80% of clinical liver metastases express a NANOG with 75% of the positive metastases containing NANOGP8 transcripts. In all, 3-62% of single cells within six CRC lines form spheroids in serum-free medium in suspension. NANOGP8 is translated into protein. The relative expression of a NANOG gene increased 8- to 122-fold during spheroid formation, more than the increase in OCT4 or SOX2 transcripts with NANOGP8 the more prevalent family member. Short hairpin RNA (shRNA) to NANOG not only inhibits spherogenicity but also reduces expression of OCT4 and SOX2, the size of the SP and tumor growth in vivo. Inhibition of NANOG gene expression is associated with inhibition of proliferation and decreased phosphorylation of G2-related cell-cycle proteins. Overexpression of NANOGP8 rescues single-cell spherogenicity when NANOG gene expression is inhibited and increases the SP in CRC. Thus, NANOGP8 can substitute for NANOG in directly promoting stemness in CRC.


Conflict of interest statement

Conflict of interest

The authors declare no conflict of interest.

Figures

Figure 1
Figure 1. The Retrogene NANOGP8 is Upregulated in Clinical Samples
(a–b) 5 μ formalin-fixed paraffin embedded specimens of liver metastases sections were analyzed for the expression of NANOG protein and CD44v6 by immunofluorescence assay (IFA) that included DAPI nuclear counter stains. Patient 9 (whose tumor expressed only NANOGP8 transcripts) (a) is shown. Positive controls included similar sections of formalin-fixed paraffin-embedded human seminoma that is known to express nuclear NANOG (b). Images were captured on a Nikon 90i microscope with a DU888 EMCCD camera and analyzed with NIS-Elements software. Object magnification, 20X. White Bars are 10 microns. (c) The restriction endonuclease that distinguishes the two genes is AlwNI, an enzyme that identifies a palindromic hexanucleotide sequence in NANOGP8 but not NANOG at position 144 relative to the translational start site. (d–f) Sections from liver metastases that had been resected were microdissected and total RNA prepared from tumor and adjacent normal liver. RT-PCR products were run out on agarose gels and GAPDH as an internal control and 8 metastatic tumors (T) and 4 adjacent microscopically normal liver samples (N) contained NANOG transcripts (d). When the positive cDNAs from Panel d were subjected to digestion with AlwNI, 6 tumor samples and 1 adjacent liver contained NANOGP8 (e–f). These results were confirmed by direct sequencing (data not shown). The relative NANOGP8 expression is calculated as the ratio between densitometry reading of NANOGP8 and total NANOG by using Image J software. Abbreviations: M, 100bp DNA ladder marker; bp, base pair; UD, undigested; D, digested with AlwNI; N, adjacent normal liver sample; T, tumor sample; +, positive; −, negative.
Figure 2
Figure 2. NANOGP8 is Prevalent Form of NANOG Expressed in CRC Lines
(a–b) Total RNA was extracted and qRT-PCR was performed for embryonic stem cell TFs. The results were normalized to GAPDH and HCC 2998 monolayers. Mean % ± SD. (c–d) Restriction endonuclease digestion of 260 nt length of NANOG by RT-PCR amplifies a region where there is a SNP that identifies NANOGP8. Digestion with AlwNI reveals that even in monolayer culture NANOGP8 is frequently expressed in CRC lines (c) as well as in spheroids (d). The relative NANOGP8 expression is calculated as the ratio between densitometry reading of NANOGP8 and total NANOG by using Image J software. Direct sequencing confirmed that NANOGP8 is consistently upregulated in Clone A and CX-1 spheroids (e). Numbers in (e) stand for the numbers of NANOG or NANOGP8 in sequenced clones. (f) MS/MS spectrum of a NANOGP8 tryptic peptide GKQPTSAENSVAK. This peptide is unique to NANOGP8, which includes the shift from Lys (K) in NANOG to Asn (N) in NANOGP8 at codon 82. Abbreviations: M, 100bp DNA ladder marker; bp, base pair; UD, undigested; D, digested with AlwNI.
Figure 3
Figure 3. Modulation of NANOG Gene Expression Affects Spherogenicity in CRC Lines
(a) Single cells were cultured in serum-free medium in ULLA microtiter plates for 9 days and then scored for the number of spheroids that each single cell produced (Mean ± SD of % of single cells that formed spheroids of 50 or more cells). All CRC lines formed spheroids at frequencies that ranged from 1 – 56% of single cells plated. (b) Western blot of NANOG in parental cells, control vector (pLKO.1) and shNANOG transduced Clone A, CX-1. (c–d) Single cells forming spheroids were scored in Clone A (c) and CX-1 (d) transduced with lentiviral vectors containing shRNA to NANOG, pLKO.1, full length NANOG, or full length NANOGP8. shNANOG inhibited spheroid formation in both CRC compared to the parental cells. In addition, shNanog cells were secondarily transduced with Nanog or NANOGP8 for 5 days before culture for single cell spherogenicity or evaluation of transcript expression. Recovery of NANOGP8 either in Clone A or CX-1 transduced shNANOG restored the single cell spherogenicity. Mean ± SD of single cells forming spheroids of 50 or more cells. (e–f) Restriction endonuclease digestion of 260 nt length of NANOG by RT-PCR amplifies a region where there is a single nucleotide alteration that identifies NANOGP8. Digestion with AlwNI reveals that shNANOG inhibits NANOG and transduction with either lentiviral vector NANOG or NANOGP8 increased NANOG or NANOGP8 trancripts, respectively. The relative NANOGP8 expression is calculated as the ratio between densitometry reading of NANOGP8 and total NANOG by using Image J software. Abbreviations: M, 100bp DNA ladder marker; bp, base pair; UD, undigested; D, digested with AlwNI.
Figure 4
Figure 4. shNANOG Inhibits Tumorigenicity and Experimental Metastasis
(a–b) Groups of 5 – 10 NOD/SCID mice were injected with dilutions of 103–105 viable CX-1 cells subcutaneously in NOD/SCID mice. Parental, pLKO.1 and shNANOG transductants were scored for the appearance of tumors over 70 days after tumor inoculation. shNANOG decreased tumorigenicity at each dilution (a). 105 CX-1 cells transducted with lentiviral vectors containing shRNA to NANOG, pLKO.1, or the intact NANOG coding sequence were injected into NOD/SCID mice. shNANOG decreases growth by prolonging the median days to appearance of tumors as well as the percentage of mice that are tumor free in mice injected with CX-1 cells (b). Overexpression of NANOG shortened the median number of days to tumor appearance compared to the pLKO.1 group (b). (c) When 2 × 10⁶ CX-1 cells were injected into the spleens of NOD/SCID mice, no shNANOG transduced CX-1 cells formed either gross or microscopic liver experimental metastases whereas 45 – 70% of mice injected with parental or control vector did. Error bars: SD. Experimental metastasis from Parental CX-1 did not generate fibrosis or host inflammatory response (data not shown).
Figure 5
Figure 5. shNANOG Induces Cell Cycle Inhibition in CRC
Clone A and CX-1 cells transduced with LV shNANOG, RFP control (RFP), full length NANOG or NANOGP8 were analyzed for cell proliferation (a, b) and expression of cell cycle-related proteins by Western blot (c). Controls were either the untreated parental CRC cell line or the pLKO.1 empty vector control. Wee1 protein expression is decreased in Clone A and CX-1 with a reduction in phosphorylation of cdc2, chk1, and CDC25C (c). P values by contingency table analysis with Bonferroni correction. * P<0.05 vs Parental Clone A or CX-1. (d) Detection of the NANOG and Pin 1 in Clone A cells by IFA. Object magnification: 40X. (e) The interaction of NANOG protein and Pin 1 in Clone A and Clone A transduced with NANOGP8 shown by reciprocal co-immunoprecipitation analysis. + and − refer to IP with or without primary antibody as negative controls in immunoprecipitation. IP, immunoprecipitation; WB, Western blotting.
Figure 6
Figure 6. Inhibition of NANOGP8 Inhibits Spherogenicity, Tumorigenicity and the size of Side Population in CRC Cells
(a–b) PA-1 is a human embryonal stem cell line that only expresses NANOG whereas CX-1 expresses both NANOG and NANOG P8. shNP8-1 did not decrease NANOG levels in PA-1 although shNg-1 did (a) but decreased transcript levels in CX-1 cells (b). Data normalized by GAPDH levels and levels of transcripts in the parental untreated line. P values after Bonferroni correction of contingency table analysis. * P<0.01 vs Parental PA-1 or CX-1. (c–d) Effect of shRNA on single cell spherogenicity of Clone A (c), CX-1 (d), and LS 174T (e). shNP8-1 inhibited spherogenicity in all 3 CRC lines whereas shNg-1 did not. Mean % ± SD. P values by contingency table analysis with Bonferroni correction. P values after Bonferroni correction of contingency table analysis. ** P <0.001 vs Parental Clone A or CX-1. (f–g) Detection of SP in CX-1 (g) and KM-12c (h) transduced with control (shNeg), shNp8-1, RFP control (RFP), the intact NANOG coding sequence (NANOG) or the NANOGP8 coding sequence (NANOGP8). Mean % ± SD. P values by contingency table analysis with Bonferroni correction. * P<0.01 vs Parental CX-1 or KM-12c. (h–j) Groups of 10 mice were injected with 105 cells per mouse transduced with lentiviral shRNA for 7 days or untreated tumor cells and then sacrificed at day 26 (CX-1 (h–i)) or day 31 (Clone A (j)). Five tumors are shown from each CX-1 group (h) and tumor weights are shown in (i–j). The dotted line is a cut-off of 75 mg with both CX-1 and Clone A transduced tumors weighing less than 75 mg whereas the untreated CX-1 (i) or Clone A (j) were heavier. P value by contingency table analysis with Bonferroni correction.

Similar articles

Cited by

References

    1. Takahashi K, Yamanaka S. Induction of pluripotent stem cells from mouse embryonic and adult fibroblast cultures by defined factors. Cell. 2006;126:663–676. - PubMed
    1. Takahashi K, Tanabe K, Ohnuki M, Narita M, Ichisaka T, Tomoda K, et al. Induction of pluripotent stem cells from adult human fibroblasts by defined factors. Cell. 2007;131:861–872. - PubMed
    1. Yu J, Hu K, Smuga-Otto K, Tian S, Stewart R, Slukvin II, et al. Human induced pluripotent stem cells free of vector and transgene sequences. Science. 2009;324:797–801. - PMC - PubMed
    1. Park IH, Arora N, Huo H, Maherali N, Ahfeldt T, Shimamura A, et al. Disease-specific induced pluripotent stem cells. Cell. 2008;134:877–886. - PMC - PubMed
    1. Miyoshi N, Ishii H, Nagai K, Hoshino H, Mimori K, Tanaka F, et al. Defined factors induce reprogramming of gastrointestinal cancer cells. Proc Natl Acad Sci U S A. 2010;107:40–45. - PMC - PubMed

Publication types

MeSH terms