Dynamic contrast-enhanced optical imaging of in vivo organ function
- PMID: 23085904
- PMCID: PMC3434471
- DOI: 10.1117/1.JBO.17.9.096003
Dynamic contrast-enhanced optical imaging of in vivo organ function
Abstract
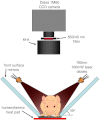
Conventional approaches to optical small animal molecular imaging suffer from poor resolution, limited sensitivity, and unreliable quantitation, often reducing their utility in practice. We previously demonstrated that the in vivo dynamics of an injected contrast agent could be exploited to provide high-contrast anatomical registration, owing to the temporal differences in each organ's response to the circulating fluorophore. This study extends this approach to explore whether dynamic contrast-enhanced optical imaging (DyCE) can allow noninvasive, in vivo assessment of organ function by quantifying the differing cellular uptake or wash-out dynamics of an agent in healthy and damaged organs. Specifically, we used DyCE to visualize and measure the organ-specific uptake dynamics of indocyanine green before and after induction of transient liver damage. DyCE imaging was performed longitudinally over nine days, and blood samples collected at each imaging session were analyzed for alanine aminotransferase (ALT), a liver enzyme assessed clinically as a measure of liver damage. We show that changes in DyCE-derived dynamics of liver and kidney dye uptake caused by liver damage correlate linearly with ALT concentrations, with an r2 value of 0.91. Our results demonstrate that DyCE can provide quantitative, in vivo, longitudinal measures of organ function with inexpensive and simple data acquisition.
Figures


Similar articles
-
Dynamic contrast enhanced fluorescent molecular imaging of vascular disruption induced by combretastatin-A4P in tumor xenografts.J Biomed Nanotechnol. 2014 Aug;10(8):1545-51. doi: 10.1166/jbn.2014.1949. J Biomed Nanotechnol. 2014. PMID: 25016654 Free PMC article.
-
Quantitative evaluation of liver function with MRI Using Gd-EOB-DTPA.Korean J Radiol. 2004 Oct-Dec;5(4):231-9. doi: 10.3348/kjr.2004.5.4.231. Korean J Radiol. 2004. PMID: 15637473 Free PMC article.
-
Quantitative Functional Evaluation of Liver Fibrosis in Mice with Dynamic Contrast-enhanced Photoacoustic Imaging.Radiology. 2021 Jul;300(1):89-97. doi: 10.1148/radiol.2021204134. Epub 2021 Apr 27. Radiology. 2021. PMID: 33904773
-
In vivo optical imaging and dynamic contrast methods for biomedical research.Philos Trans A Math Phys Eng Sci. 2011 Nov 28;369(1955):4620-43. doi: 10.1098/rsta.2011.0264. Philos Trans A Math Phys Eng Sci. 2011. PMID: 22006910 Free PMC article. Review.
-
Hepatic gadoxetic acid uptake as a measure of diffuse liver disease: Where are we?J Magn Reson Imaging. 2017 Mar;45(3):646-659. doi: 10.1002/jmri.25518. Epub 2016 Nov 8. J Magn Reson Imaging. 2017. PMID: 27862590 Review.
Cited by
-
Early Detection of Acute Drug-Induced Liver Injury in Mice by Noninvasive Near-Infrared Fluorescence Imaging.J Pharmacol Exp Ther. 2017 Apr;361(1):87-98. doi: 10.1124/jpet.116.238378. Epub 2017 Jan 23. J Pharmacol Exp Ther. 2017. PMID: 28115551 Free PMC article.
-
Dynamic contrast enhanced fluorescent molecular imaging of vascular disruption induced by combretastatin-A4P in tumor xenografts.J Biomed Nanotechnol. 2014 Aug;10(8):1545-51. doi: 10.1166/jbn.2014.1949. J Biomed Nanotechnol. 2014. PMID: 25016654 Free PMC article.
-
Noncontact recognition of fluorescently labeled objects in deep tissue via a novel optical light beam arrangement.PLoS One. 2018 Dec 19;13(12):e0208236. doi: 10.1371/journal.pone.0208236. eCollection 2018. PLoS One. 2018. PMID: 30566459 Free PMC article.
-
Paradigms in Fluorescence Molecular Imaging: Maximizing Measurement of Biological Changes in Disease, Therapeutic Efficacy, and Toxicology/Safety.Mol Imaging Biol. 2019 Aug;21(4):599-611. doi: 10.1007/s11307-018-1273-0. Mol Imaging Biol. 2019. PMID: 30218390 Review.
-
Acceleration of dynamic fluorescence molecular tomography with principal component analysis.Biomed Opt Express. 2015 May 8;6(6):2036-55. doi: 10.1364/BOE.6.002036. eCollection 2015 Jun 1. Biomed Opt Express. 2015. PMID: 26114027 Free PMC article.
References
Publication types
MeSH terms
Substances
Grants and funding
LinkOut - more resources
Full Text Sources
Medical

