

In vivo functional imaging of blood flow and wall strain rate in outflow tract of embryonic chick heart using ultrafast spectral domain optical coherence tomography
- PMID: 23085907
- PMCID: PMC3434623
- DOI: 10.1117/1.JBO.17.9.096006
In vivo functional imaging of blood flow and wall strain rate in outflow tract of embryonic chick heart using ultrafast spectral domain optical coherence tomography
Abstract
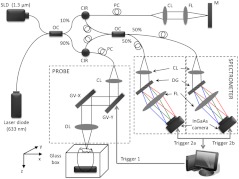
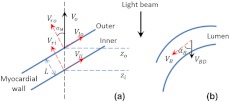
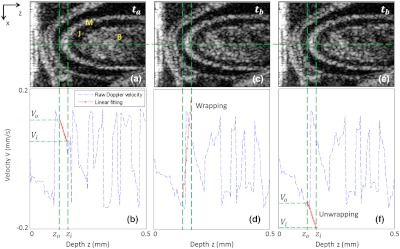
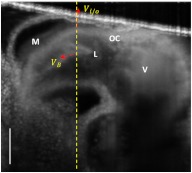
During cardiac development, the cardiac wall and flowing blood are two important cardiac tissues that constantly interact with each other. This dynamic interaction defines appropriate biomechanical environment to which the embryonic heart is exposed. Quantitative assessment of the dynamic parameters of wall tissues and blood flow is required to further our understanding of cardiac development. We report the use of an ultrafast 1310-nm dual-camera spectral domain optical coherence tomography (SDOCT) system to characterize/image, in parallel, the dynamic radial strain rate of the myocardial wall and the Doppler velocity of the underlying flowing blood within an in vivo beating chick embryo. The OCT system operates at 184-kHz line scan rate, providing the flexibility of imaging the fast blood flow and the slow tissue deformation within one scan. The ability to simultaneously characterize tissue motion and blood flow provides a useful approach to better understand cardiac dynamics during early developmental stages.
Figures


Similar articles
-
Extracting cardiac shapes and motion of the chick embryo heart outflow tract from four-dimensional optical coherence tomography images.J Biomed Opt. 2012 Sep;17(9):96005-1. doi: 10.1117/1.JBO.17.9.096005. J Biomed Opt. 2012. PMID: 23085906 Free PMC article.
-
Optical coherence tomography provides an ability to assess mechanical property of cardiac wall of developing outflow tract in embryonic heart in vivo.J Biomed Opt. 2012 Dec;17(12):120502. doi: 10.1117/1.JBO.17.12.120502. J Biomed Opt. 2012. PMID: 23208209
-
In vivo assessment of wall strain in embryonic chick heart by spectral domain optical coherence tomography.Appl Opt. 2015 Nov 1;54(31):9253-7. doi: 10.1364/AO.54.009253. Appl Opt. 2015. PMID: 26560579
-
The complementary roles of radionuclide myocardial perfusion imaging and cardiac computed tomography.Semin Roentgenol. 2012 Jul;47(3):228-39. doi: 10.1053/j.ro.2011.11.012. Semin Roentgenol. 2012. PMID: 22657113 Review. No abstract available.
-
Experimental assessment of cardiovascular physiology in the chick embryo.Dev Dyn. 2023 Oct;252(10):1247-1268. doi: 10.1002/dvdy.589. Epub 2023 May 30. Dev Dyn. 2023. PMID: 37002896 Review.
Cited by
-
Optical coherence tomography guided microinjections in live mouse embryos: high-resolution targeted manipulation for mouse embryonic research.J Biomed Opt. 2015 May;20(5):051020. doi: 10.1117/1.JBO.20.5.051020. J Biomed Opt. 2015. PMID: 25581495 Free PMC article.
-
Bioimaging of Dissolvable Microneedle Arrays: Challenges and Opportunities.Research (Wash D C). 2022 Aug 1;2022:9758491. doi: 10.34133/2022/9758491. eCollection 2022. Research (Wash D C). 2022. PMID: 36034102 Free PMC article. Review.
-
4D shear stress maps of the developing heart using Doppler optical coherence tomography.Biomed Opt Express. 2012 Nov 1;3(11):3022-32. doi: 10.1364/BOE.3.003022. Epub 2012 Oct 31. Biomed Opt Express. 2012. PMID: 23162737 Free PMC article.
-
Validating the Paradigm That Biomechanical Forces Regulate Embryonic Cardiovascular Morphogenesis and Are Fundamental in the Etiology of Congenital Heart Disease.J Cardiovasc Dev Dis. 2020 Jun 12;7(2):23. doi: 10.3390/jcdd7020023. J Cardiovasc Dev Dis. 2020. PMID: 32545681 Free PMC article. Review.
-
Animal Models for Heart Valve Research and Development.Drug Discov Today Dis Models. 2017 Summer;24:55-62. doi: 10.1016/j.ddmod.2018.04.001. Epub 2018 May 28. Drug Discov Today Dis Models. 2017. PMID: 30631375 Free PMC article.
References
-
- Fercher F., et al. , “Optical coherence tomography—principles and applications,” Rep. Progr. Phys. 66, 239–303 (2003).
-
- Tomlins P. H., Wang R. K., “Theory, developments and applications of optical coherence tomography,” J. Phys. D: Appl. Phys. 38(15), 2519–2535 (2005).JPAPBE10.1088/0022-3727/38/15/002 - DOI
