

Functional classification of skeletal muscle networks. I. Normal physiology
- PMID: 23085959
- PMCID: PMC3544495
- DOI: 10.1152/japplphysiol.01514.2011
Functional classification of skeletal muscle networks. I. Normal physiology
Abstract
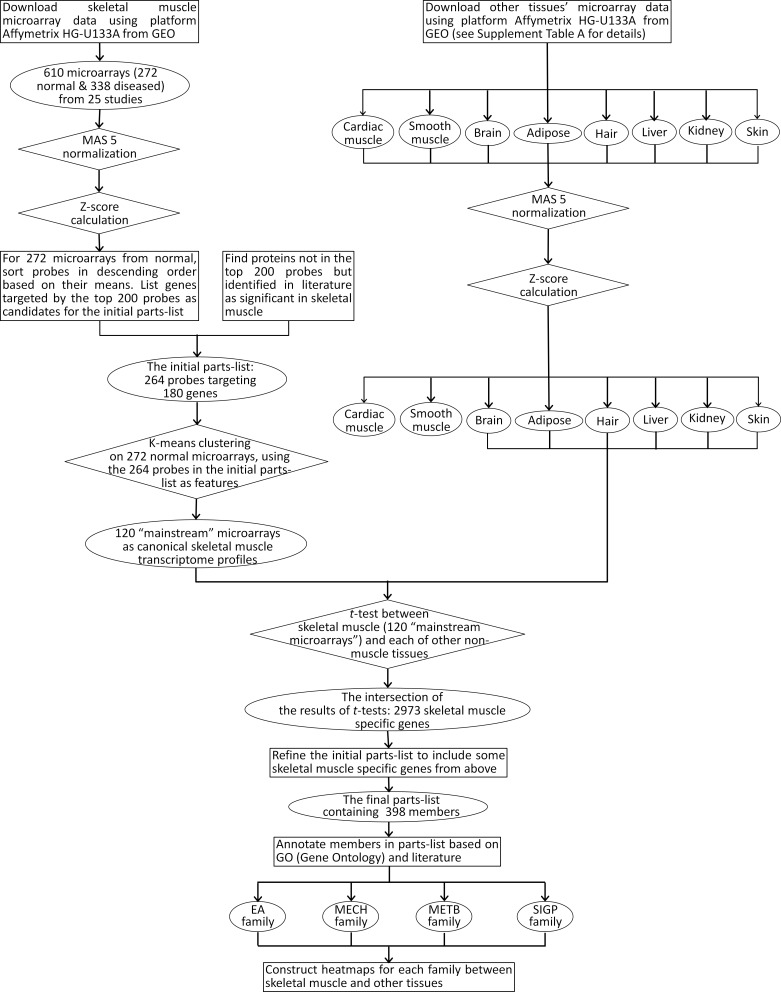
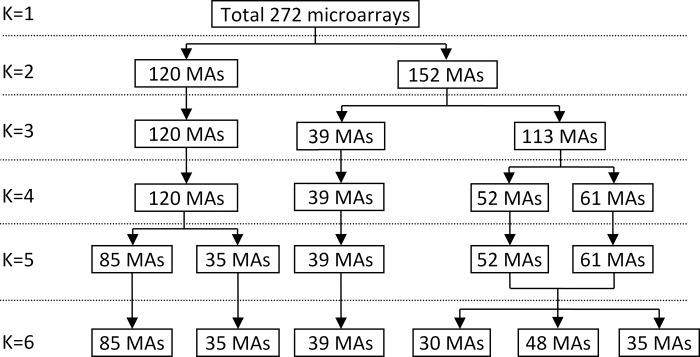
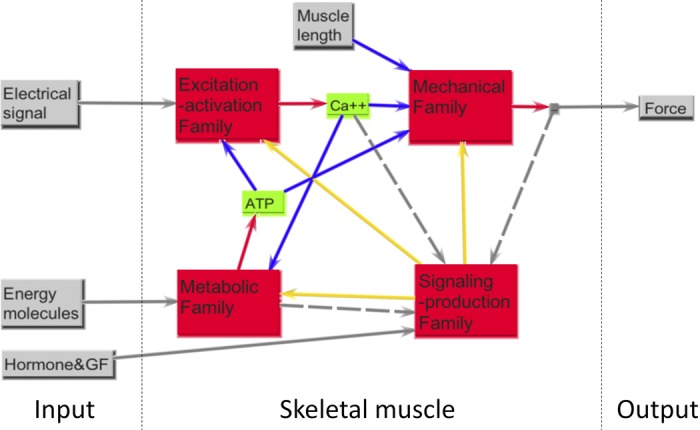
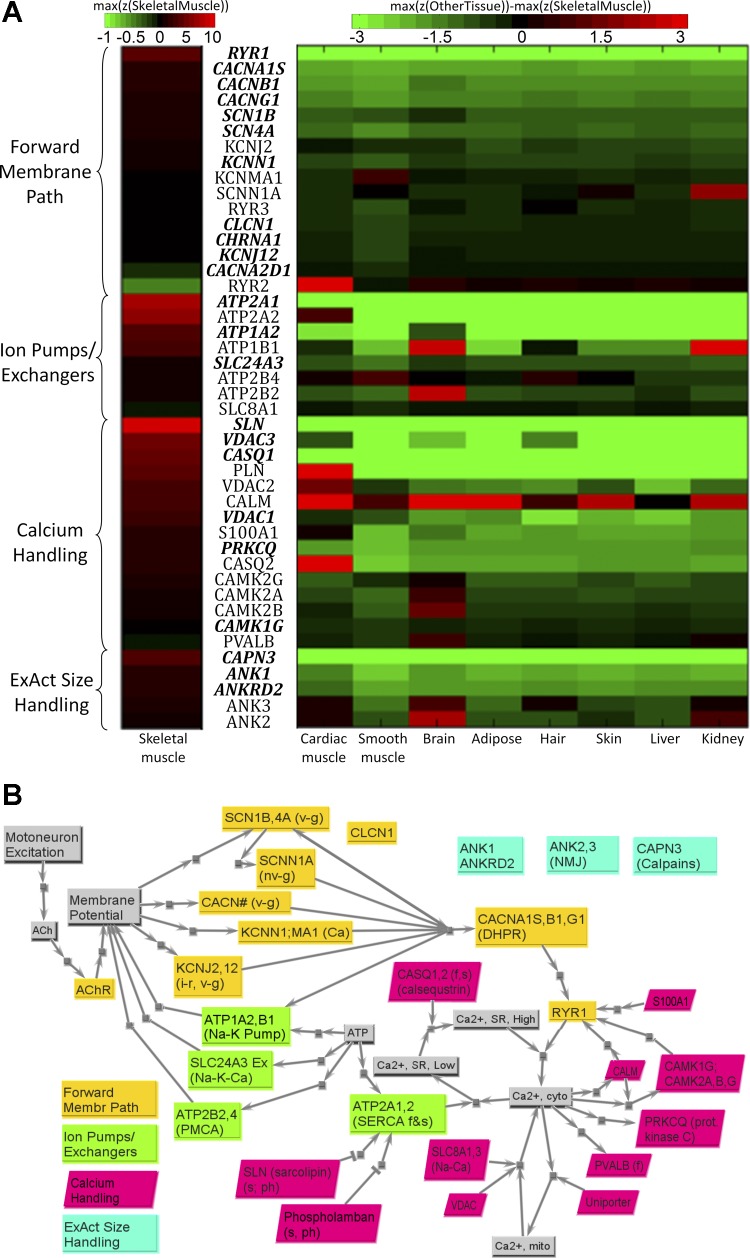
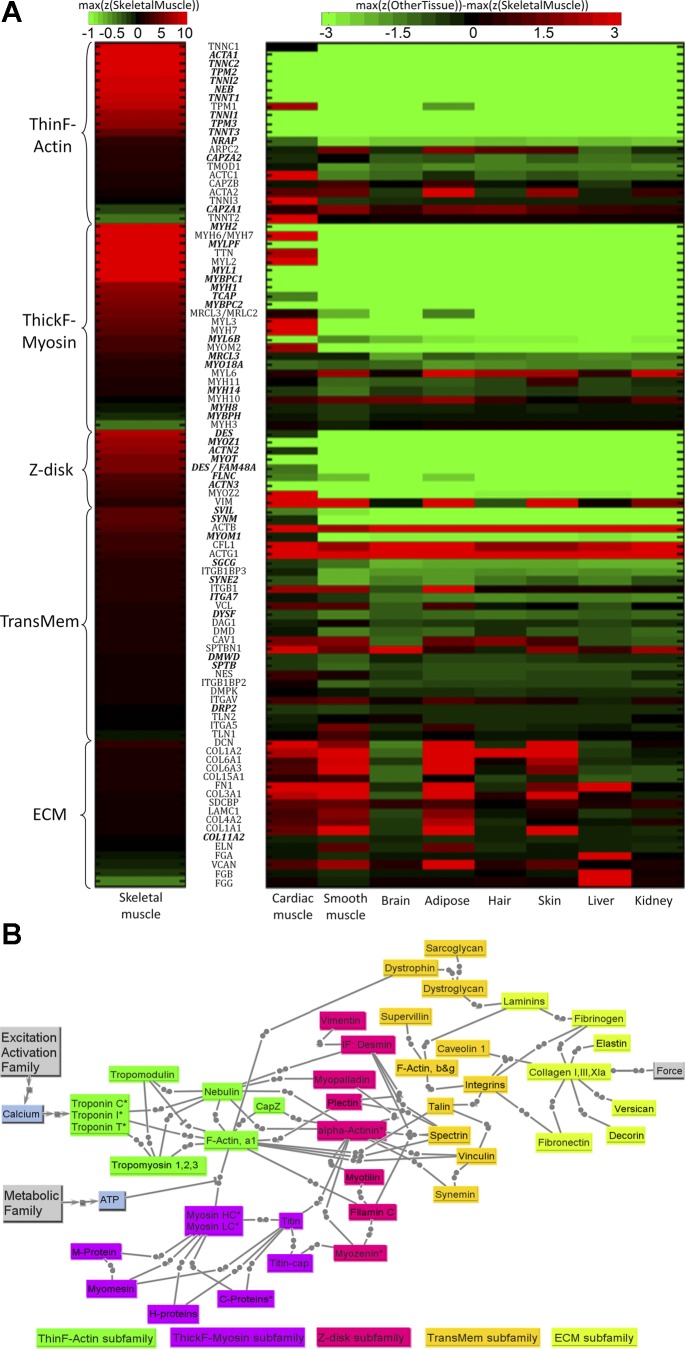
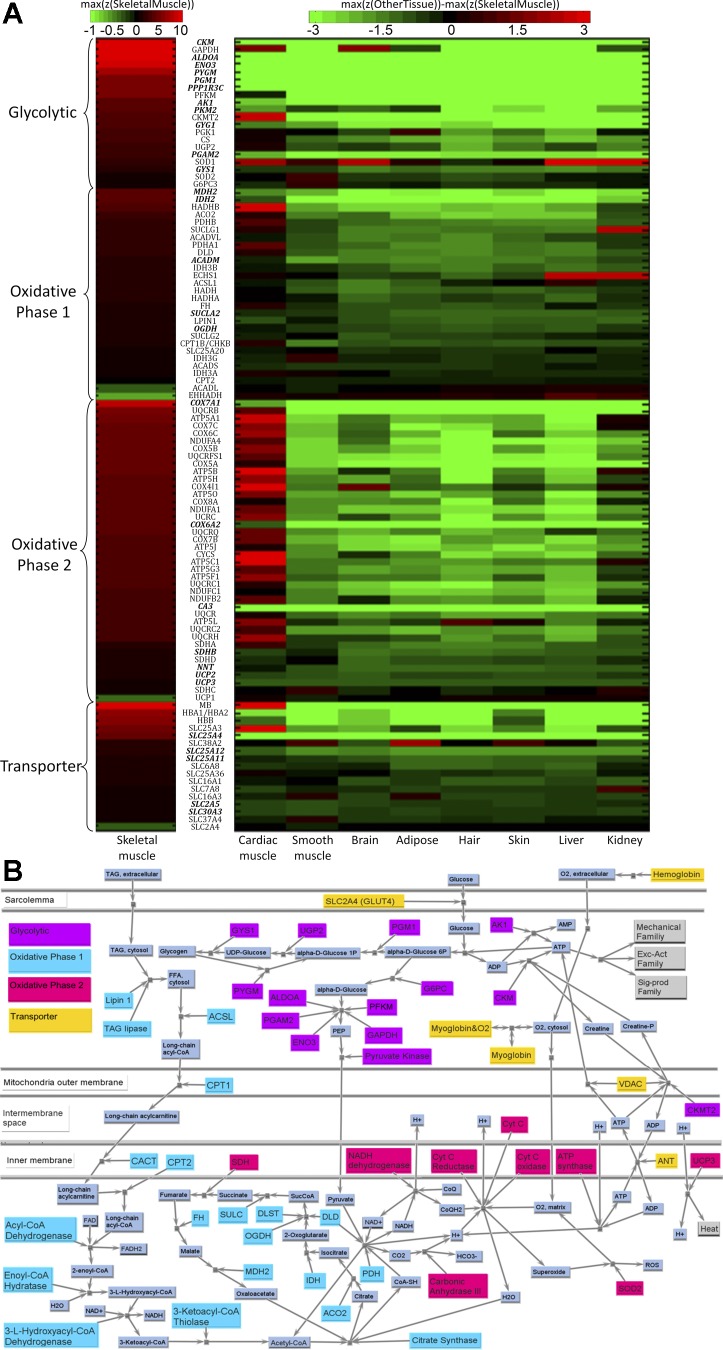
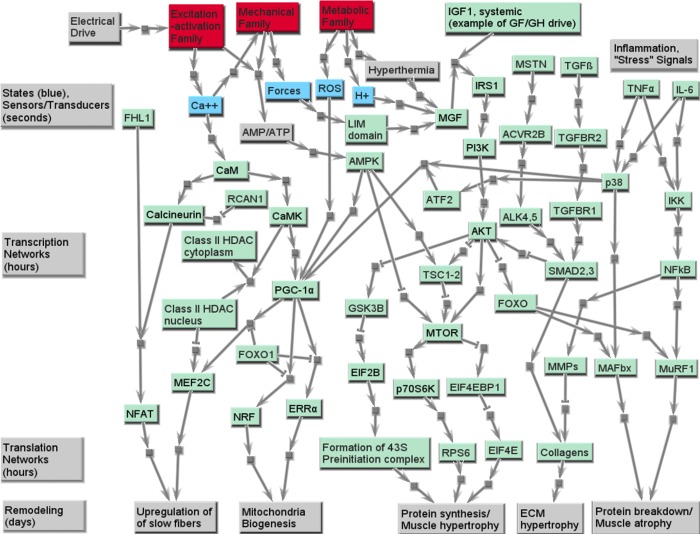
Extensive measurements of the parts list of human skeletal muscle through transcriptomics and other phenotypic assays offer the opportunity to reconstruct detailed functional models. Through integration of vast amounts of data present in databases and extant knowledge of muscle function combined with robust analyses that include a clustering approach, we present both a protein parts list and network models for skeletal muscle function. The model comprises the four key functional family networks that coexist within a functional space; namely, excitation-activation family (forward pathways that transmit a motoneuronal command signal into the spatial volume of the cell and then use Ca(2+) fluxes to bind Ca(2+) to troponin C sites on F-actin filaments, plus transmembrane pumps that maintain transmission capacity); mechanical transmission family (a sophisticated three-dimensional mechanical apparatus that bidirectionally couples the millions of actin-myosin nanomotors with external axial tensile forces at insertion sites); metabolic and bioenergetics family (pathways that supply energy for the skeletal muscle function under widely varying demands and provide for other cellular processes); and signaling-production family (which represents various sensing, signal transduction, and nuclear infrastructure that controls the turn over and structural integrity and regulates the maintenance, regeneration, and remodeling of the muscle). Within each family, we identify subfamilies that function as a unit through analysis of large-scale transcription profiles of muscle and other tissues. This comprehensive network model provides a framework for exploring functional mechanisms of the skeletal muscle in normal and pathophysiology, as well as for quantitative modeling.
Figures
Similar articles
-
Functional classification of skeletal muscle networks. II. Applications to pathophysiology.J Appl Physiol (1985). 2012 Dec 15;113(12):1902-20. doi: 10.1152/japplphysiol.01515.2011. Epub 2012 Oct 18. J Appl Physiol (1985). 2012. PMID: 23085957 Free PMC article.
-
Filament compliance influences cooperative activation of thin filaments and the dynamics of force production in skeletal muscle.PLoS Comput Biol. 2012;8(5):e1002506. doi: 10.1371/journal.pcbi.1002506. Epub 2012 May 10. PLoS Comput Biol. 2012. PMID: 22589710 Free PMC article.
-
Systems analysis of biological networks in skeletal muscle function.Wiley Interdiscip Rev Syst Biol Med. 2013 Jan-Feb;5(1):55-71. doi: 10.1002/wsbm.1197. Epub 2012 Nov 27. Wiley Interdiscip Rev Syst Biol Med. 2013. PMID: 23188744 Free PMC article. Review.
-
Regulation of contraction in striated muscle.Physiol Rev. 2000 Apr;80(2):853-924. doi: 10.1152/physrev.2000.80.2.853. Physiol Rev. 2000. PMID: 10747208 Review.
-
Conformational switching in muscle.Adv Exp Med Biol. 2004;547:61-80. doi: 10.1007/978-1-4419-8861-4_6. Adv Exp Med Biol. 2004. PMID: 15230093 Review.
Cited by
-
Functional classification of skeletal muscle networks. II. Applications to pathophysiology.J Appl Physiol (1985). 2012 Dec 15;113(12):1902-20. doi: 10.1152/japplphysiol.01515.2011. Epub 2012 Oct 18. J Appl Physiol (1985). 2012. PMID: 23085957 Free PMC article.
-
Statistical insights into major human muscular diseases.Hum Mol Genet. 2014 Jul 15;23(14):3772-8. doi: 10.1093/hmg/ddu090. Epub 2014 Feb 25. Hum Mol Genet. 2014. PMID: 24569163 Free PMC article.
-
Genistein Promotes Skeletal Muscle Regeneration by Regulating miR-221/222.Int J Mol Sci. 2022 Nov 3;23(21):13482. doi: 10.3390/ijms232113482. Int J Mol Sci. 2022. PMID: 36362267 Free PMC article.
-
Community Structure Analysis of Gene Interaction Networks in Duchenne Muscular Dystrophy.PLoS One. 2013 Jun 19;8(6):e67237. doi: 10.1371/journal.pone.0067237. Print 2013. PLoS One. 2013. PMID: 23840633 Free PMC article.
-
Systems analysis of transcriptional data provides insights into muscle's biological response to botulinum toxin.Muscle Nerve. 2014 Nov;50(5):744-58. doi: 10.1002/mus.24211. Epub 2014 Mar 17. Muscle Nerve. 2014. PMID: 24536034 Free PMC article.
References
-
- Adhihetty PJ, Irrcher I, Joseph AM, Lyubicic V, Hood DA. Plasticity of skeletal muscle mitochondria in response to contractile activity. Exp Physiol 88: 99–107, 2003. - PubMed
-
- Allen DG, Lamb GD, Westerblad H. Skeletal muscle fatigue: cellular mechanisms. Physiol Rev 88: 287–332, 2007. - PubMed
-
- Allen DG, Lännergren J, Westerblad H. Intracellular ATP measured with luciferin/luciferase in isolated single mouse skeletal muscle fibers. Pflügers Arch 443: 836–842, 2002. - PubMed
-
- Armani A, Galli S, Giacomello E, Bagnato P, Barone V, Rossi D, Sorrentino V. Molecular interactions with obscurin are involved in the localization of muscle-specific small ankyrin 1 isoforms to subcompartments of the sarcoplasmic reticulum. Exp Cell Res 312: 3546–3558, 2006. - PubMed
Publication types
MeSH terms
Substances
Grants and funding
LinkOut - more resources
Full Text Sources
Miscellaneous