. 2012 Nov 14;31(22):4289-303.
doi: 10.1038/emboj.2012.286. Epub 2012 Oct 19.

Wig1 prevents cellular senescence by regulating p21 mRNA decay through control of RISC recruitment

Affiliations

Wig1 prevents cellular senescence by regulating p21 mRNA decay through control of RISC recruitment

Bong Cho Kim et al. EMBO J. .

Abstract

Premature senescence, a key strategy used to suppress carcinogenesis, can be driven by p53/p21 proteins in response to various stresses. Here, we demonstrate that Wig1 plays a critical role in this process through regulation of p21 mRNA stability. Wig1 controls the association of Argonaute2 (Ago2), a central component of the RNA-induced silencing complex (RISC), with target p21 mRNA via binding of the stem-loop structure near the microRNA (miRNA) target site. Depletion of Wig1 prohibited miRNA-mediated p21 mRNA decay and resulted in premature senescence. Wig1 plays an essential role in cell proliferation, as demonstrated in tumour xenografts in mice, and Wig1 and p21 mRNA levels are inversely correlated in human normal and cancer tissues. Together, our data indicate a novel role of Wig1 in RISC target accessibility, which is a key step in RNA-mediated gene silencing. In addition, these findings indicate that fine-tuning of p21 levels by Wig1 is essential for the prevention of cellular senescence.


Conflict of interest statement

The authors declare that they have no conflict of interest.

Figures
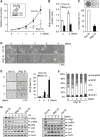
Figure 1
Figure 1
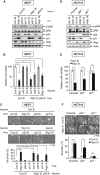
Depletion of Wig1 in MCF7 cancer cells induces premature senescence via G1 arrest. (A) Growth retardation of either control siRNA (Con Si)- or Wig1 siRNA (Wig1 Si)-transfected MCF7 cells. Viable cell numbers were determined using a trypan blue exclusion assay at the indicated times after transfection with 100 nM Wig1 Si (in box). (B) A BrdU incorporation assay was conducted in Wig1 Si-transfected MCF7 cells at the indicated times. Values are expressed as the relative BrdU incorporation in Wig Si-transfected cells compared to Con Si-transfected cells. (C) Colony-forming ability of Wig1 Si-transfected cells. Cells were fixed and stained 7 days after siRNA transfection. (D) Morphologic changes of Wig1 Si-transfected MCF7 cells. (E) SA-β-Gal positivity was evaluated after siRNA transfection (left panel). Percentages of SA-β-Gal-positive cells are plotted (right panel). (F) FACS analysis of cell-cycle distribution in Wig1-depleted cells. Cells were harvested at the indicated times after Wig1 Si transfection. (G) Molecular status of phospho-pRB, p53, and p21 in Wig1-depleted cells. The cells were harvested at the indicated times after siRNA transfection and subjected to immunoblotting. Actin serves as a loading control. Each bar represents mean±standard deviation (s.d.) from three independent experiments. An asterisk indicates a significant difference, P<0.05.
Figure 2
Figure 2
p21 is essential for the induction of Wig1 depletion-mediated premature senescence that occurs in a p53-independent manner. (A) Western blot analysis in siRNA-transfected MCF7 cells. Cells were transfected with Con Si, Wig1 Si, p53 siRNA (p53 Si), or p21 siRNA (p21 Si) 24 h prior to transfection with Con Si, Wig1 Si, or p53 Si as indicated. After a 2-day incubation, cells were subjected to immunoblot analysis. Actin serves as a loading control. (B) Viable cells were counted using a trypan blue exclusion assay 4 days after double transfections as in (A). Cell numbers in Wig1 Si-, p53 Si-, and p21 Si-transfected cells are shown as a relative value compared to Con Si-transfected cells. (C) Cellular morphology and SA-β-Gal positivity analyses were performed 4 days after double transfections as in (A). (D) Western blot analysis of Wig1 Si-transfected HCT116 parental, p53−/−, and p21−/− isogenic cell lines. The cell lines were incubated for 2 days after transfection with either Con Si or Wig1 Si and then subjected to immunoblotting. (E) Viable cells were counted using a trypan blue exclusion assay 4 days after Wig1 Si transfection of HCT116 isogenic cell lines, and cell counts in Wig Si-transfected cells are presented as a relative value compared to each Con Si-transfected isogenic cell line. (F) Cellular morphology and SA-β-Gal positivity were determined 4 days after Wig1 Si transfection. Each bar represents mean±s.d. from three independent experiments. An * or # indicates either P<0.05 or P>0.05, respectively.
Figure 3
Figure 3
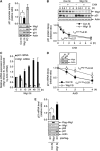
Wig1 plays a role in the regulation of p21 mRNA stability. (A) p21 promoter activity. Firefly luciferase activities were measured in MCF7 cells 2 days after co-transfection with a luciferase vector containing the p21 promoter and Renilla luciferase pRL-CMV (RL) reference plasmid prior to Wig1 Si transfection (upper). Cells exposed to 6 Gy of ionizing radiation (IR) were used as a positive control (PC). Purified proteins were subjected to immunoblotting (lower). (B) Wig1 depletion-mediated p21 protein decay in the presence of cycloheximide (CHX). MCF7 cells were treated with 40 μg/ml CHX following Wig1 Si transfection and then harvested at the indicated times for immunoblot analysis (upper). The normalized band intensities were evaluated with ImageJ software (lower). (C) Relative p21 mRNA levels in Wig1-depleted cells. Purified RNA harvested at the indicated times after Wig1 Si transfection was subjected to qRT–PCR using p21- or Wig1-specific primers. The data were normalized to actin mRNA levels. (D) Actinomycin D (ActD) chase experiment. Twenty-four hours after transfection with Wig1 Si (in box), 5 μg/ml ActD was added to cells for the indicated times. Purified RNA was subjected to qRT–PCR with p21-specific primers. (E) Effects of Wig1 overexpression on p21 mRNA and protein levels. RNA was isolated from cells transfected with either p3xFlag-empty vector (p3xFlag–EV) or p3xFlag–Wig1 in combination with either Con Si or Wig1 Si as indicated. Then, qRT–PCR was performed using p21-specific primers. Relative mRNA levels were normalized to actin mRNA (upper). Proteins were subjected to immunoblot analysis (lower). Each bar represents mean±s.d. from three independent experiments. t1/2 indicates the estimated half-lives of p21 protein or mRNA after Wig1 Si transfection. An * or # indicates either P<0.05 or P>0.05, respectively.
Figure 4
Figure 4
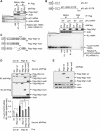
Wig1 binds to the 3′UTR of the p21 mRNA through zinc finger domains 1 and 2. (A) Ribonucleoprotein immunoprecipitation (RNP-IP) assay. MCF7 cells were harvested 2 days after transfection with either p3xFlag–EV or p3xFlag–Wig1 (Flag–Wig1), and then an RNP-IP assay using anti-Flag M2 affinity gel was performed. Immunoprecipitated proteins were then subjected to immunoblotting using anti-Flag antibody (upper). Isolated total RNA was radiolabelled with RT–PCR using p21-specific primers (lower), and band intensities were quantified using imaging software. The four leftmost lanes represent two-fold serial dilutions of RNA and demonstrate that the RT–PCR is semiquantitative. (B) Interaction of Wig1 and p21 3′UTR reporter. Schematic representations of pFL-EV and pFL-p21-3′UTR, which encodes the N-terminal portion of firefly luciferase with the full-length 3′UTR of p21 (upper). HEK 293T cells were transfected with either pFL-EV or pFL-p21-3′UTR in combination with p3xFlag–EV or p3xFlag–Wig1. Cells were also co-transfected with pRL-CMV (pRL) as a reference plasmid. Cells were harvested 2 days after transfection and subjected to RNP-IP using anti-Flag M2 affinity gel. Purified RNA from IP was radiolabelled using RT–PCR using RL- and FL-specific primers, and products were subjected to PAGE. The p21 3′UTR reporter mRNA levels were quantified using imaging software, and data are presented as mean±s.d. from three independent experiments (lower). (C) Schematic representations of the p3xFlag–Wig1-wild-type (wt), p3xFlag–Wig1-mutant 1 (mut1), and p3xFlag–Wig1-mutant 2 (mut2) overexpression plasmids. ZF, zinc finger; NLS, nuclear localization signal. (D) Immunoblotting and qRT–PCR. MCF7 cells were transfected with Wig1 Si prior to transfection with pFL-p21-3′UTR in combination with p3xFlag–EV, p3xFlag–Wig1-wt, p3xFlag–Wig1-mut1, or p3xFlag–Wig1-mut2. The cells were also co-transfected with pRL-CMV as a reference plasmid. Whole cell lysates and RNA were isolated 2 days after transfection. Endogenous Wig1 depletion and recombinant Wig1 overexpression were assessed using immunoblot analysis (upper). The qRT–PCR analysis shows the relative levels of FL-p21-3′UTR reporter mRNA (lower). Each bar represents mean±s.d. from three independent experiments. An * or # indicates either P<0.05 or P>0.05, respectively. (E) Endogenous p21 protein levels in cells overexpressing recombinant Wig1. MCF7 cells were harvested 2 days after transfection with p3xFlag–EV, p3xFlag–Wig1-wt, p3xFlag–Wig1-mut1, or p3xFlag–Wig1-mut2 and subjected to immunoblotting.
Figure 5
Figure 5
Wig1 is essential for recruitment of RNA-inducing silencing complex (RISC) to the p21 mRNA 3′UTR. (A) Protein–protein interactions between Wig1 and Ago2. Endogenous Ago2 protein was immunoprecipitated from MCF7 cell lysates with polyclonal anti-Ago2 antibody and then subjected to immunoblotting using anti-Ago2 and anti-Wig1 antibodies as indicated. (B) Physical interaction between Wig1 and Ago2. HEK 293T cell lysates were isolated after co-transfection with pCK-Flag–Ago2 and pCMV-Myc–Wig1 and immunoprecipitated using anti-Flag M2 affinity gel. RNase A was added to half of each sample prior to immunoprecipitation. Immunoblotting was performed to detect the protein interaction (upper). GAPDH mRNA was analysed using RT–PCR to demonstrate that RNase A digestion was complete (lower). (C) In vitro binding assay of polyhistidine-tagged Ago2 (His–Ago2) and glutathione S transferase-tagged Wig1 (GST–Wig1) proteins. Equal amounts of recombinant His–Ago2 proteins were precipitated with glutathione beads via bound GST or GST–Wig1 proteins. Precipitates were then subjected to immunoblotting with anti-His and anti-GST antibodies as indicated (left). Conversely, the GST–Wig1 proteins were precipitated with Ni-NTA agarose beads via bound His–Ago2 proteins and then subjected to immunoblot analysis (right). (D) Interaction of Ago2 with Wig1 mutant proteins. Lysates from Flag–Wig1-wt-, Flag–Wig1-mut1-, or Flag–Wig1-mut2-expressing HEK 293T cells were subjected to immunoprecipitation using anti-Flag M2 affinity gel followed by immunoblotting with anti-Ago2 antibody as indicated. (E, G) Association of either Wig1 or Ago2 with RISC. Ago2- or Wig1-depleted HEK 293T cells were transfected with either p3xFlag–Wig1 or pCK-Flag–Ago2, respectively. Proteins were immunoprecipitated using anti-Flag M2 affinity gel. Western blot analysis was used to detect the association of the specified proteins. (F) Interaction of Wig1 with the p21 3′UTR in the absence of Ago2. Ago2-depleted HEK 293T cells were harvested 2 days after transfection with pFL-p21-3′UTR in combination with either p3xFlag–EV or p3xFlag–Wig1 and pRL as a reference plasmid, and then an RNP-IP assay was performed with anti-Flag M2 affinity gel. Proteins were subjected to immunoblotting using anti-Flag and anti-Ago2 antibodies as indicated (upper). Total RNA isolated from IP was radiolabelled using RT–PCR with RL- and FL-specific primers and subjected to PAGE (lower). (H) No interaction of Ago2 with the p21 3′UTR was observed in the absence of Wig1. Wig1-depleted HEK 293T cells were harvested 2 days after transfection of pFL-p21-3′UTR in combination with either pCK-Flag–EV or pCK-Flag–Ago2 and pRL as a reference plasmid and then subjected to RNP-IP as described in (F). The four leftmost lanes represent two-fold serial dilutions of RNA and demonstrate that the RT–PCR is semiquantitative. The p21 3′UTR reporter mRNA levels were quantified by imaging software, and data are presented as mean±s.d. from three independent experiments (bottom in F and H). NS indicates non-specific bands.
Figure 6
Figure 6
Wig1 binds to the miR-106b recognition site and enhances the accessibility of RISC. (A) Schematic representation of the candidate binding sites of miRNAs in the 3′UTR via the TargetScan database. (B) Effect of miRNAs on the p21 3′UTR reporter in Wig1-depleted MCF7 cells. Cells were harvested 2 days after transfection with either pFL-EV or pFL-p21-3′UTR, 100 nM of each miRNA candidate, and pRL-CMV as a reference plasmid following Wig1 Si transfection. Total RNA was subjected to qRT–PCR to quantitate FL-3′UTR mRNA abundance (upper). Whole cell lysates were subjected to immunoblot analysis. The p21 protein levels were determined by quantification of band intensities (lower). (C) Effects of miRNA on the p21 3′UTR reporter in the presence of Wig1 overexpression. Cells were harvested 2 days after transfection with the p21 3′UTR reporter and miRNA mimics as in (B) following transfection with either p3xFlag–EV or p3xFlag–Wig1. Total RNA was subjected to qRT–PCR to quantitate FL-3′UTR mRNA (upper). Whole cell lysates were subjected to immunoblotting, and p21 protein levels were quantitated as described in (B) (lower). (D) Interaction of miR-106b with p21 3′UTR reporter mRNA in the absence of Wig1. Cells expressing the p21 3′UTR reporter were transfected with biotinylated miR-106b in combination with Wig1 Si, and then lysates were subjected to precipitation using streptavidin-conjugated beads. RNA was purified from precipitates, and qRT–PCR was performed. (E) Cloning strategy of the miR-106b target region in the p21 3′UTR. Three stem-loop structures in the p21 3′UTR (spanning nt 366–488) were placed in the pFL-p21-3′UTR. pFL-p21-3′UTR-F1 contains both nt 366–384 and nt 464–488 including the miR-106 target site. The pFL-p21-3′UTR-F2 and pFL-p21-3′UTR-F3 contain nt 387–426 and nt 427–454, respectively. The pFL-p21-3′UTR (366–488)-ΔmiR is a mutant in which the miR-106 target site in p21 3′UTR (nt 366–488) was deleted. The base-pair probability is indicated in the colour key. (F) The Wig1-interacting region in p21 3′UTR spanning nt 366–488. HEK 293T cells that overexpressed Flag-tagged Wig1 were harvested 2 days after transfection with pFL-EV, pFL-p21-3′UTR-F1, pFL-p21-3′UTR-F2, pFL-p21-3′UTR-F3, or pFL-p21-3′UTR (366–488) in combination with the pRL-CMV reference plasmid. An RNP-IP assay using anti-Flag M2 affinity gel was performed. Immunoblot analysis using anti-Flag antibody (upper). RNA isolated from immunoprecipitates was radiolabelled using RT–PCR with RL- and FL-specific primers, and the products were subjected to PAGE. The four leftmost lanes represent two-fold serial dilutions of RNA and demonstrate that the RT–PCR is semiquantitative (lower). (G) Levels of p21 3′UTR reporters that contain stem-loop structures in the p21 3′UTR nt 366–488 in Wig1-depleted MCF7 cells. Following Wig1 Si transfection, the cells were transfected with the p21 3′UTR reporter vector as in (F), and cells were then harvested after 2 days. Isolated RNA was subjected to qRT–PCR using RL- and FL-specific primers. (H) Effects of deletion of the miR-106b target site in the p21 3′UTR (nt 366–488) in Wig1-depleted MCF7 cells. Cells were transfected with Wig1 Si and then pFL-p21-3′UTR (366–488) or pFL-p21-3′UTR (366–488)-ΔmiR in combination with the pRL-CMV reference plasmid. Cells were harvested 2 days after transfection, and then isolated RNA was subjected to qRT–PCR using RL- and FL-specific primers. Knockdown effects of Wig1 are shown in boxes for (G) and (H). The intensity values of qRT–PCR represent mean±s.d. from three independent experiments. Amplified RNA intensities before IP were quantified, and data are presented as mean±s.d. from three independent experiments (bottom in D and F). An * or # indicates either P<0.05 or P>0.05, respectively.
Figure 7
Figure 7
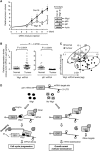
Wig1 depletion in a murine xenograft model and Wig1 and p21 mRNA levels in human cancer tissues. (A) H460 cells (1 × 10⁶) were injected subcutaneously into the femurs of nude mice. When tumours reached 50 mm3, 200 μl AteloGene gel containing 20 μM of Wig1 Si was injected to encompass the whole tumour mass. Tumour size was then measured at the indicated times. Error bars represent s.d. (n≥3) (left). Xenograft tissue lysates at 5 days after siRNA injection were subjected to immunoblot analysis (right). An asterisk indicates a significant difference, P<0.05. (B) Quantitative RT–PCR analysis of Wig1 and p21 mRNA in patient tissues. RNA was purified from lung cancer tissues and corresponding normal counterparts from 33 patients and subjected to qRT–PCR using Wig1- and p21-specific primers. Expression levels were normalized to actin mRNA. The correlation between the relative levels of Wig1 and p21 mRNA was analysed by tumour versus normal counterpart expression ratio of either Wig1 or p21 mRNA using the Pearson correlation coefficient. Error bars represent standard error of the mean (s.e.m.). (C) In vivo correlation between Wig1 and p21 mRNA expression in each patient tissue. Expression levels in either normal or tumour tissues were clustered as either solid or dotted lines, respectively. Normalized Wig1 and p21 mRNA levels from each individual sample were plotted on logarithmic scales. (D) Proposed model for Wig1-dependent target recognition of RISC. Wig1 is a critical determinant for the decision between proliferation and cellular senescence via fine-tuning of p21 mRNA levels through facilitation of the accessibility of RISC to its target. In the presence of Wig1, RISC is effectively recruited to the target p21 mRNA, modulates its decay, and finally results in cell-cycle progression. In the case of Wig1 depletion, p21 mRNA is stabilized, leading to the onset of cellular senescence.

Similar articles

Cited by

References

    1. Abbas T, Dutta A (2009) p21 in cancer: intricate networks and multiple activities. Nat Rev Cancer 9: 400–414 - PMC - PubMed
    1. Bartel DP (2009) MicroRNAs: target recognition and regulatory functions. Cell 136: 215–233 - PMC - PubMed
    1. Bhattacharyya SN, Habermacher R, Martine U, Closs EI, Filipowicz W (2006) Relief of microRNA-mediated translational repression in human cells subjected to stress. Cell 125: 1111–1124 - PubMed
    1. Brodersen P, Voinnet O (2009) Revisiting the principles of microRNA target recognition and mode of action. Nat Rev Mol Cell Biol 10: 141–148 - PubMed
    1. Brugarolas J, Chandrasekaran C, Gordon JI, Beach D, Jacks T, Hannon GJ (1995) Radiation-induced cell cycle arrest compromised by p21 deficiency. Nature 377: 552–557 - PubMed

Publication types