. 2013 Feb;27(2):522-35.
doi: 10.1096/fj.12-213439. Epub 2012 Oct 19.

MicroRNA 339 down-regulates μ-opioid receptor at the post-transcriptional level in response to opioid treatment

Affiliations

MicroRNA 339 down-regulates μ-opioid receptor at the post-transcriptional level in response to opioid treatment

Qifang Wu et al. FASEB J. 2013 Feb.

Abstract

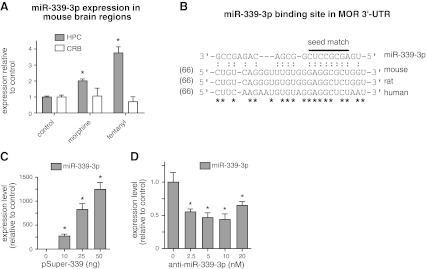
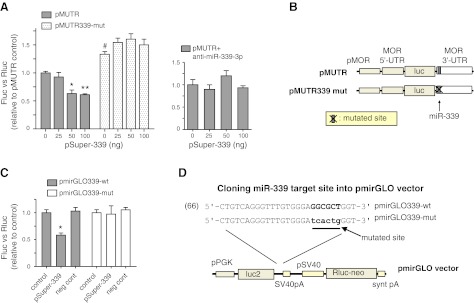
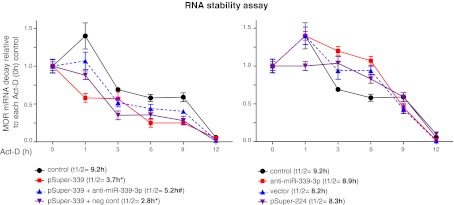
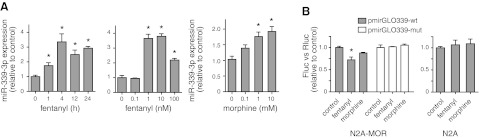
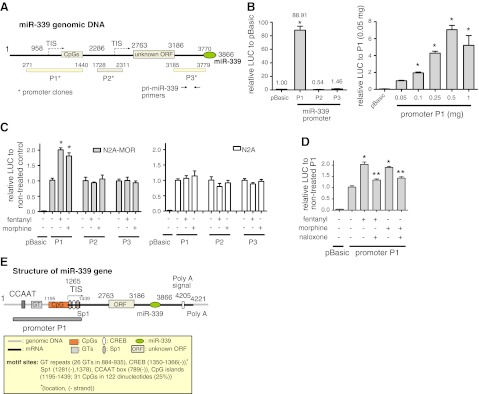
μ-Opioid receptor (MOR) level is directly related to the function of opioid drugs, such as morphine and fentanyl. Although agonist treatment generally does not affect transcription of mor, previous studies suggest that morphine can affect the translation efficiency of MOR transcript via microRNAs (miRNAs). On the basis of miRNA microarray analyses of the hippocampal total RNA isolated from mice chronically treated with μ-opioid agonists, we found a miRNA (miR-339-3p) that was consistently and specifically increased by morphine (2-fold) and by fentanyl (3.8-fold). miR-339-3p bound to the MOR 3'-UTR and specifically suppressed reporter activity. Suppression was blunted by adding miR-339-3p inhibitor or mutating the miR-339-3p target site. In cells endogenously expressing MOR, miR-339-3p inhibited the production of MOR protein by destabilizing MOR mRNA. Up-regulation of miR-339-3p by fentanyl (EC(50)=0.75 nM) resulted from an increase in primary miRNA transcript. Mapping of the miR-339-3p primary RNA and its promoter revealed that the primary miR-339-3p was embedded in a noncoding 3'-UTR region of an unknown host gene and was coregulated by the host promoter. The identified promoter was activated by opioid agonist treatment (10 nM fentanyl or 10 μM morphine), a specific effect blocked by the opioid antagonist naloxone (10 μM). Taken together, these results suggest that miR-339-3p may serve as a negative feedback modulator of MOR signals by regulating intracellular MOR biosynthesis.


Figures

Figure 1.
Figure 1.
Induction of miR-339-3p by morphine and fentanyl in mouse brain. A) Increased expression of miR-339-3p in mouse hippocampus (HPC) treated with morphine or fentanyl and analyzed by microarray experiments. Drugs were administered at a rate of 1 μl/h for 3 d. Mice were treated with saline (control), 12 μg/h morphine, or 0.31 μg/h fentanyl. Each group involved 4 mice. Data were analyzed by 1-way ANOVA with post hoc Dunnett's test for comparisons. Values presented are compared to control values. B) Target site of miR-339-3p in the MOR 3′-UTR was conserved in mouse, rat, and human. Seed match (indicated by overbar) has more conserved sequences in those species. Numbers in parentheses indicate nucleotide distance downstream of MOR stop codon. Colon (:) indicates possible ribonucleotide binding between MOR 3′-UTR and miR-339-3p. C) pSuper-339 containing miR-339-3p was transfected into N2A-MOR cells, and expression of miR-339-3p was analyzed by real-time qRT-PCR. D) Anti-miR-339-3p decreased endogenous miR-339-3p expression. Anti-miR-339-3p was transfected into N2A-MOR cells and analyzed by real-time qRT-PCR. Graphs indicate the averages from ≥3 representative experiments. Asterisks in graphs indicate statistically significant findings. Error bars = se. *P < 0.05 vs. control.
Figure 2.
Figure 2.
Regulation of MOR by miR-339-3p through MOR 3′-UTR. A) pMUTR and pMUTR339-mut were cotransfected with varying amounts of pSuper-339 into HEK293T cells. At 24 h after transfection, firefly luciferase activity was assessed and normalized to Renilla luciferase activity. In the second graph, 10 nM anti-miR-339-3p was added to the transfection of pMUTR. Control: 0 ng of pSuper-339. Graphs indicate the averages from ≥3 representative experiments. Error bars = se. *P < 0.05, **P < 0.01 vs. control; #P < 0.05 vs. pMUTR; 2-way ANOVA. B) Reporter constructs pMUTR and pMUTR339-mut. pMOR indicates MOR promoter. Arrow indicates binding site of miR-339-3p; X indicates the mutated target site. C) The miR-339-3p target site of the MOR 3′-UTR is functional for the effect of miR-339-3p. Luciferase/Renilla ratio results for HEK293T cells cotransfected with 100 ng pSuper vector (control), 100 ng pSuper-339, or 20 nM miR negative control (neg cont; anti-miR; Applied Biosystems) together with pmirGLO339-wt (wild type, shaded bars) or pmirGLO339-mut (mutant, white bars) for 24 h. Renilla expression from the pmirGLO vector was used for Luc/Renilla ratio quantification. Results are presented as a fold difference relative to wild-type control cells transfected with pSuper vector and pmirGLO339-wt. Graphs indicate the averages from ≥3 representative experiments. Error bars = se. *P < 0.05 vs. control; 2-way ANOVA. D) miR-339-3p target site in pmirGLO. MOR 3′-UTR fragments that were cloned into pmirGLO are illustrated above. Seed match for wild type is in bold; mutated sequences of the seed match are in lowercase letters.
Figure 3.
Figure 3.
Overexpression of miR-339-3p caused a decrease in MOR mRNA stability. Indicated plasmids and RNAs were cotransfected into neuronal differentiated P19 cells (AP4d) and treated with the RNA synthesis inhibitor Act-D for the indicated times or 0 h (no-treated control). Total RNA was isolated and analyzed decay ratios of MOR mRNA by real-time qRT-PCR. Values are relative to each Act-D (0 h) control after β-actin normalization (n≥3). t1/2, half-life of mRNA. *P < 0.05 vs. control; #P < 0.05 vs. pSuper-339 alone; 2-way ANOVA.
Figure 4.
Figure 4.
miR-339-3p decreased MOR protein level in neuron cells analyzed by flow cytometry. A) MOR expression was increased in neuronal differentiated P19 cells compared with undifferentiated P19 cells. Antibodies to MAP-2 (MAB3418; Millipore) and MOR were used in 2-color flow cytometry. Numbers in each section indicate percentages of cells detected by the antibodies. B) pSuper (vector), pSuper-339, and pSuper-339 + anti-miR-339-3p were transfected separately into the differentiated cells. First histogram (control) indicates a transfection reagent control without any DNA transfected. Because cells were permeabilized during incubation with primary antibody, both intracellular and cell surface MOR protein was detected. Percentages are relative to the same sample of control IgG used in flow cytometry. Bottom graph represents each green fluorescence signal for MOR expression summarized from the above four histograms after thrice-repeated experiments. Error bars = se. *P < 0.05 vs. control.
Figure 5.
Figure 5.
Overexpression of miR-339-3p caused a decrease in MOR expression in neuron-like cells analyzed by immunocytochemistry. Top panels: neuronal differentiated cells were untransfected (control; a) or transfected with pSuper-339 (b), anti-miR-339-3p (c), pSuper-339 + anti-miR-339-3p (d), pSuper-339 + negative control (neg cont; e), negative control (f), vector (g), or pSuper-224 (h). MOR protein was visualized with anti-MOR and Alexa Fluor 488 (green), and nuclei were stained with propidium idodide (PI, red). Red arrows indicate large nuclei that are likely those of glial cells differentiated from P19 cells. Much smaller nuclei/cell bodies, marked by green arrows and stained in green with anti-MOR, likely belong to neuronal cells. Bottom panel: graph indicates average fluorescence intensities. *P < 0.05 vs. control.
Figure 6.
Figure 6.
Expression of miR-339-3p was increased by MOR agonists. A) miRNA-enriched RNA was extracted from N2A-MOR cells and used in real-time qPCR. Left panel: treatment of N2A-MOR cells with 10 nM fentanyl. Control: 0 h; miR-339-3p/snoRNA-234. Middle panel: treatment of N2A-MOR cells with varying concentrations of fentanyl for 4 h (EC50=0.75 nM). Right panel: treatment of N2A-MOR cells with varying concentrations of morphine for 24 h (EC50=0.19 μM). B) pmirGLO339-wt or pmirGLO339-mut was transfected into N2A-MOR cells. At 24 h after transfection, cells were treated with 10 nM fentanyl or 10 μM morphine for 4 h, and luciferase activity was analyzed as described in Fig. 2. Transfection of pmirGLO339-wt into N2A was included as a control. One-way ANOVA with post hoc Dunnett's test was performed by comparing each sample to the control sample. Graphs show the averages of triplicate measures from ≥3 independent experiments; n ≥ 3. Error bars = se. *P < 0.05 vs. control.
Figure 7.
Figure 7.
miR-339 promoter analysis. A) miR-339 region of the mouse genome based on mouse genomic sequences from the NCBI database. P1, P2, and P3 indicate the locations of DNA fragments used for miR-339 promoter analysis. Unknown ORF encodes a hypothetical protein of unknown function found from a RIKEN full-length enriched library (AK019591.1). Dotted arrows under TIS indicate putative TISs generated by promoter search programs. B) Left panel: N2A cells were transfected with 0.5 μg cloned promoter plasmids P1, P2, or P3. Cells were harvested 48 h after transfection, lysed, and assayed for luciferase activity. Results for promoter activity are given as luciferase activity normalized against cotransfected pCH110 β-galactosidase activity. Data are the means of 3 independent experiments; n ≥ 3. Error bars = se. *P < 0.05 vs. vector control (pBasic, 0.5 μg). Right panel: varying amounts of promoter P1 plasmid were transfected into N2A cells, and promoter activity was analyzed as above. Graphed values were obtained from each value relative to luciferase activity of P1 (0.05 μg). C) Fentanyl increased P1 promoter activity. N2A (right panel) and N2A-MOR (left panel) cells were transfected with 0.5 μg promoter plasmids P1, P2, or P3. At 48 h after transfection, cells were treated with 10 nM fentanyl or10 μM morphine for 4 h. Luciferase activity was analyzed as above; n ≥ 3. *P < 0.05 vs. vector control; 1-way ANOVA. D) Promoter P1 plasmid (0.5 μg) was transfected into N2A-MOR cells pretreated with 10 μM naloxone (for indicated samples) 1 h before being treated with 10 nM fentanyl or 10 μM morphine for 4 h, followed by analysis of the promoter activity as above. Vector plasmid pBasic was included as a negative control. *P<0.05 vs. nontreated P1, **P<0.05 vs. fentanyl- or morphine-treated P1 control; 2-way ANOVA. E) miR-339 gene structure based on analysis of several gene databases. Numbers in parentheses are locations of the motifs; − indicates the motif in an antisense direction.

Similar articles

Cited by

References

    1. Law P. Y., Loh H. H., Wei L. N. (2004) Insights into the receptor transcription and signaling: implications in opioid tolerance and dependence. Neuropharmacology 47(Suppl. 1), 300–311 - PubMed
    1. Binyaminy B., Gafni M., Shapira M., Sarne Y. (2008) Agonist-specific down regulation of mu-opioid receptors: different cellular pathways are activated by different opioid agonists. Life Sci. 82, 831–839 - PubMed
    1. Kramer H. K., Simon E. J. (1999) Role of protein kinase C (PKC) in agonist-induced mu-opioid receptor down-regulation: II. Activation and involvement of the alpha, epsilon, and zeta isoforms of PKC. J. Neurochem. 72, 594–604 - PubMed
    1. Schmidt H., Schulz S., Klutzny M., Koch T., Handel M., Hollt V. (2000) Involvement of mitogen-activated protein kinase in agonist-induced phosphorylation of the mu-opioid receptor in HEK 293 cells. J. Neurochem. 74, 414–422 - PubMed
    1. Koch T., Kroslak T., Mayer P., Raulf E., Hollt V. (1997) Site mutation in the rat mu-opioid receptor demonstrates the involvement of calcium/calmodulin-dependent protein kinase II in agonist-mediated desensitization. J. Neurochem. 69, 1767–1770 - PubMed

Publication types

MeSH terms