Review
. 2013 Mar;226(1):113-25.
doi: 10.1007/s00213-012-2899-2. Epub 2012 Oct 21.

The behavioral economics of drug self-administration: a review and new analytical approach for within-session procedures

Affiliations
Review

The behavioral economics of drug self-administration: a review and new analytical approach for within-session procedures

Brandon S Bentzley et al. Psychopharmacology (Berl). 2013 Mar.

Abstract

Rationale: Behavioral-economic demand curve analysis offers several useful measures of drug self-administration. Although generation of demand curves previously required multiple days, recent within-session procedures allow curve construction from a single 110-min cocaine self-administration session, making behavioral-economic analyses available to a broad range of self-administration experiments. However, a mathematical approach of curve fitting has not been reported for the within-session threshold procedure.

Objectives: We review demand curve analysis in drug self-administration experiments and provide a quantitative method for fitting curves to single-session data that incorporates relative stability of brain drug concentration.

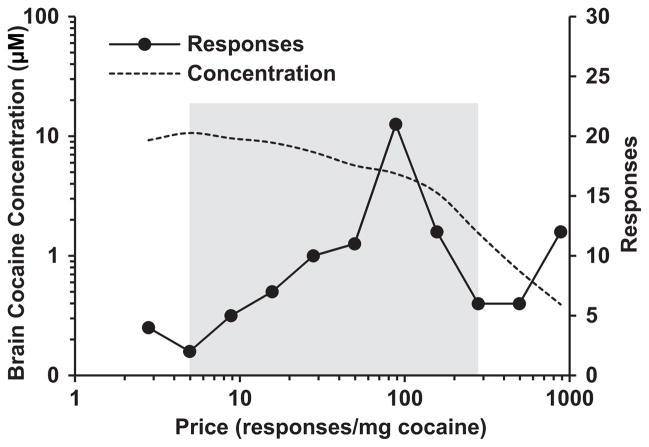
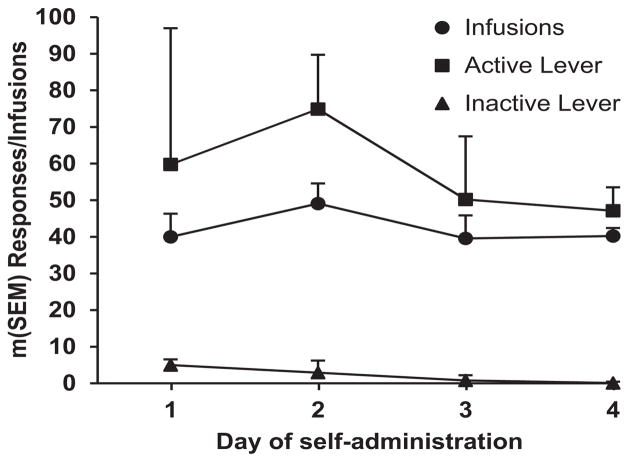
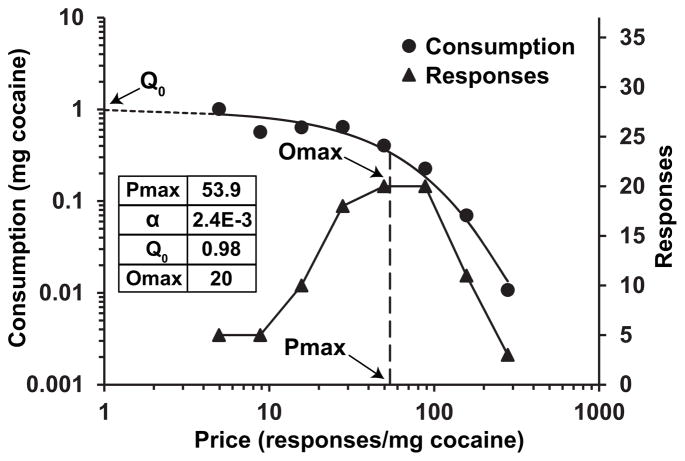
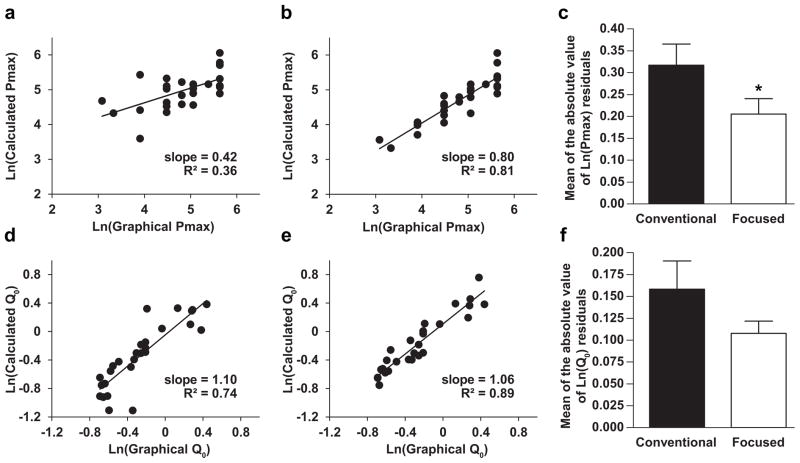
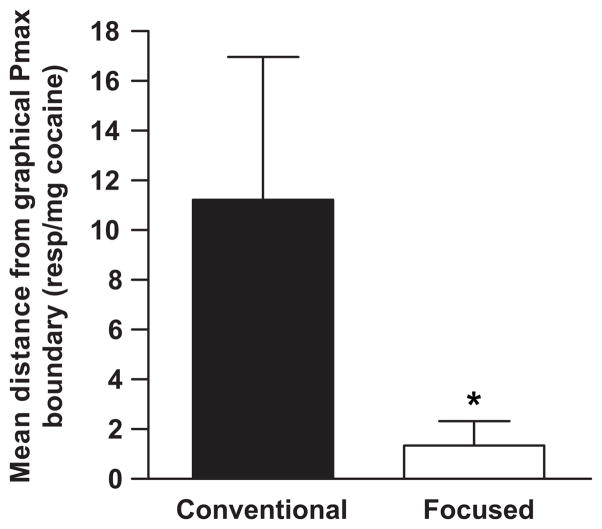
Methods: Sprague-Dawley rats were trained to self-administer cocaine, and then tested with the threshold procedure in which the cocaine dose was sequentially decreased on a fixed ratio-1 schedule. Price points (responses/mg cocaine) outside of relatively stable brain cocaine concentrations were removed before curves were fit. Curve-fit accuracy was determined by the degree of correlation between graphical and calculated parameters for cocaine consumption at low price (Q(0)) and the price at which maximal responding occurred (P(max)).

Results: Removing price points that occurred at relatively unstable brain cocaine concentrations generated precise estimates of Q(0) and resulted in P (max) values with significantly closer agreement with graphical P(max) than conventional methods.

Conclusion: The exponential demand equation can be fit to single-session data using the threshold procedure for cocaine self-administration. Removing data points that occur during relatively unstable brain cocaine concentrations resulted in more accurate estimates of demand curve slope than graphical methods, permitting a more comprehensive analysis of drug self-administration via a behavioral-economic framework.


Conflict of interest statement

Conflicts of Interest: None

Figures

Fig. 1
Fig. 1
Example of within-session threshold data from a single animal with a response-price relationship that produces 2 valleys, a marked departure from data produced from a multi-session procedure. The data points indicated by arrows were removed before demand curve regressions were calculated by the focused fitting approach. The shaded area represents the data included in the focused analysis. The brain cocaine concentration was calculated and plotted concurrently with response data to highlight the relative stability of brain cocaine concentration included in the focused analysis.
Fig. 2
Fig. 2
Cocaine self-administration under an FR-1 (20-sec timeout) schedule of reinforcement 4 days before training and testing on the within-session threshold procedure (n = 9).
Fig. 3
Fig. 3
Example of within-session threshold data from a single animal. Data points outside of relatively stable brain cocaine concentrations have been removed using the focused-fit procedure, and an exponential demand curve (Equation 1) has been added. Q0 is the theoretical demand (consumption) at a unit price of 0. Omax is the peak response output and Pmax is the unit price at which Omax occurs. Pmax is calculated from the exponential demand curve that is fit to the consumption data.
Fig. 4
Fig. 4
Comparison of accuracy of conventional vs. focused demand curve fitting. a. Pmax values obtained from conventionally fit demand curves plotted against Pmax values obtained from graphical analysis. b. Pmax values obtained from focused-fit demand curves plotted against Pmax values obtained from graphical analysis. c. Mean of the absolute values of the residuals for the linear regressions of graphically determined Pmax vs. Pmax calculated from either a conventional or focused-fit demand curve (*p < 0.05). d. Q0 values obtained from conventionally fit demand curves plotted against Q0 values obtained from graphical analysis. e. Q0 values obtained from focused-fit demand curves plotted against Q0 values obtained from graphical analysis. f. Mean of the absolute values of the residuals for the linear regressions of graphically determined Q0 vs. Q0 calculated from either a conventional or focused-fit demand curve. Each circle represents a single operant conditioning session (n = 27) from a single animal (n = 9).
Fig. 5
Fig. 5
Comparison of accuracy of conventional vs. focused demand curve fitting that takes into account a ±1 price point error in the estimation of graphical Pmax. Distance from Pmax boundary is the magnitude of the distance in units of price of the calculated Pmax to ±1 price point from graphical Pmax; *p < 0.05.

References

    1. Ahmed SH, Koob GF. Transition from moderate to excessive drug intake: change in hedonic set point. Science. 1998;282:298–300. doi: 10.1126/science.282.5387.298. - DOI - PubMed
    1. Ahmed SH, Koob GF. Long-lasting increase in the set point for cocaine self-administration after escalation in rats. Psychopharmacology. 1999;146:303–312. doi: 10.1007/s002130051121. - DOI - PubMed
    1. Bermudez MA, Schultz W. Reward magnitude coding in primate amygdala neurons. Journal of Neurophysiology. 2010;104:3424–3432. doi: 10.1152/jn.00540.2010. - DOI - PMC - PubMed
    1. Bickel WK, Green L, Vuchinich RE. Behavioral economics. J Exp Anal Behav. 1995;64:257–262. doi: 10.1901/jeab.1995.64-257. - DOI - PMC - PubMed
    1. Bickel WK, Jarmolowicz DP, Mueller ET, Gatchalian KM. The behavioral economics and neuroeconomics of reinforcer pathologies: implications for etiology and treatment of addiction. Curr Psychiatry Rep. 2011;13:406–415. doi: 10.1007/s11920-011-0215-1. - DOI - PMC - PubMed

Publication types

LinkOut - more resources