. 2013 Jan;62(1):85-95.
doi: 10.2337/db12-0291. Epub 2012 Oct 18.

PGC-1α improves glucose homeostasis in skeletal muscle in an activity-dependent manner

Affiliations

PGC-1α improves glucose homeostasis in skeletal muscle in an activity-dependent manner

Serge Summermatter et al. Diabetes. 2013 Jan.

Abstract

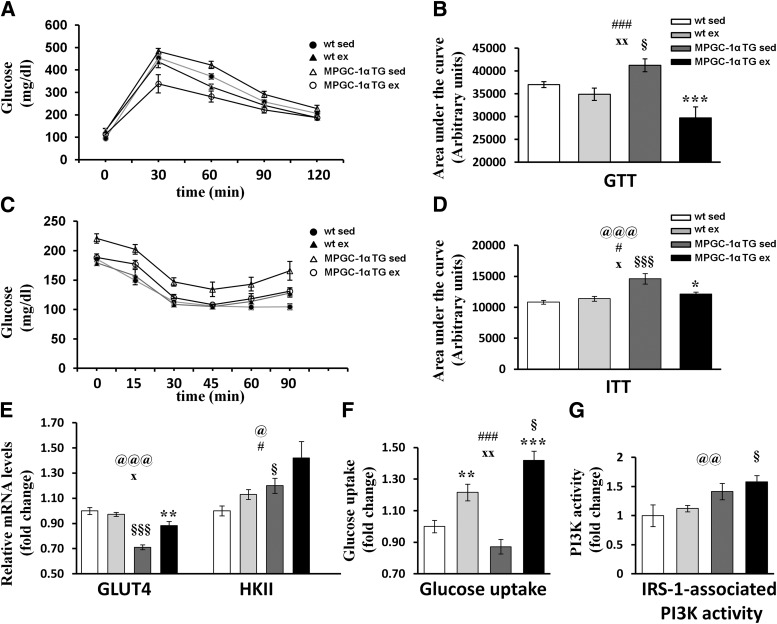
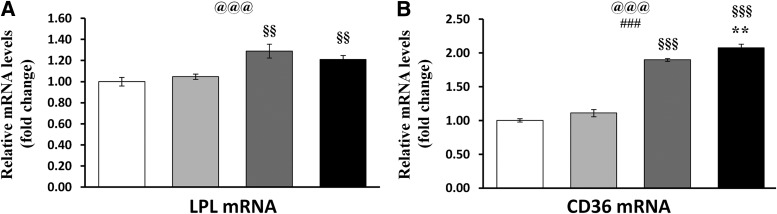
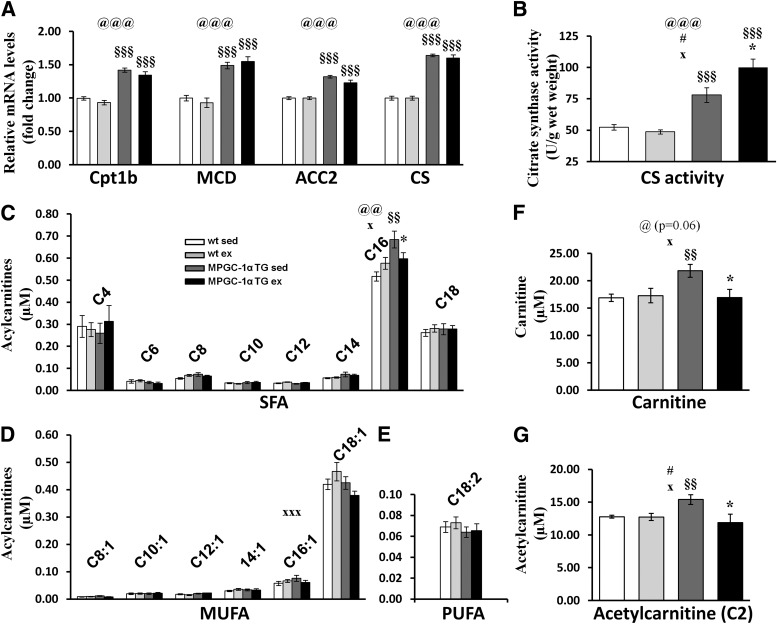
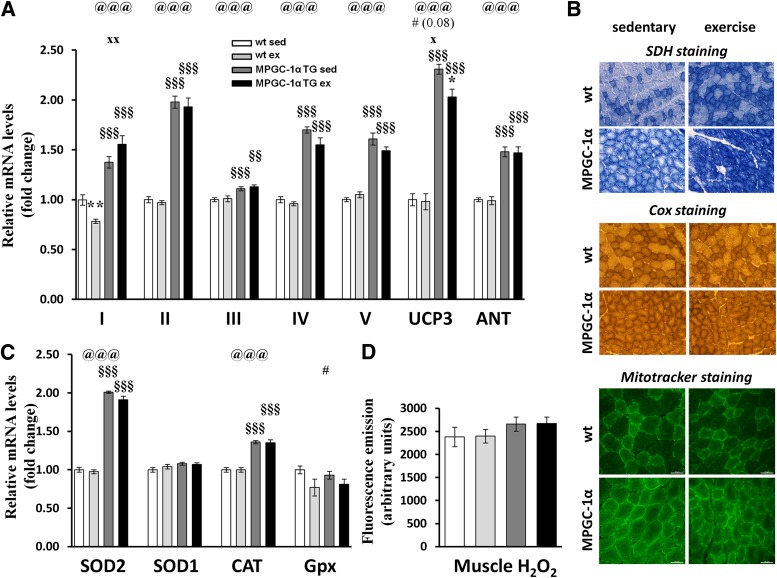
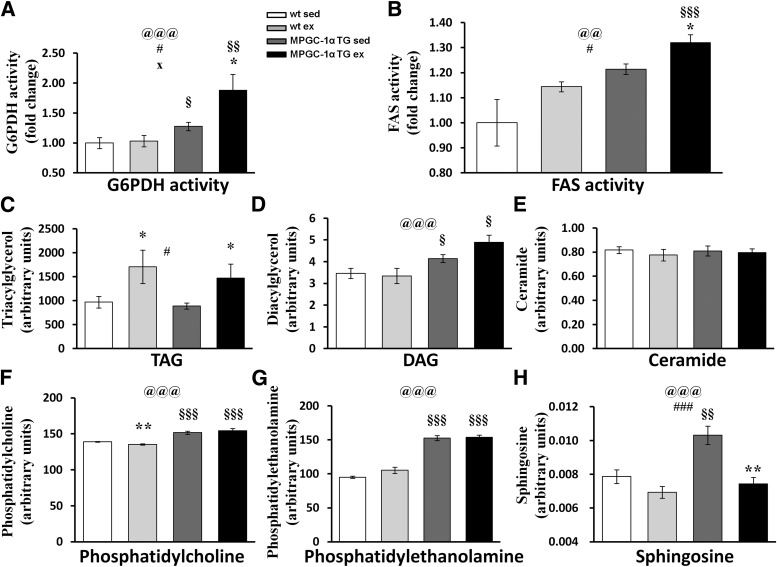
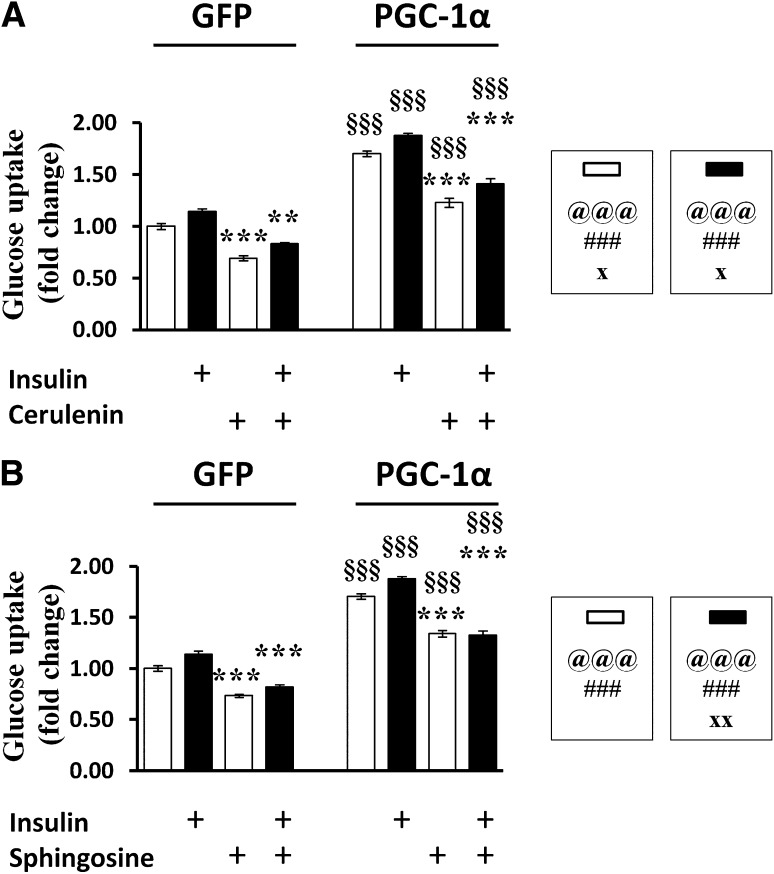
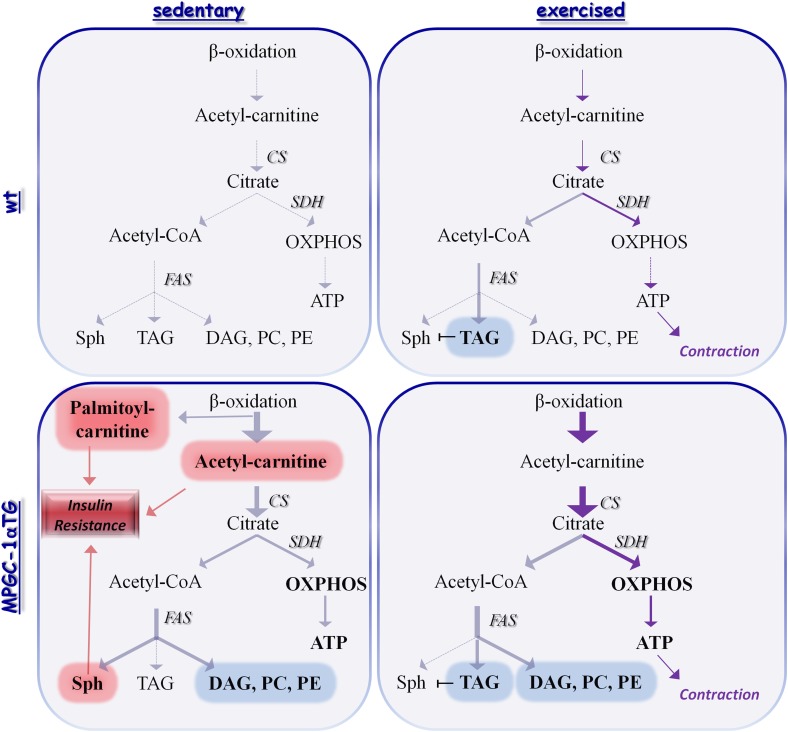
Metabolic disorders are a major burden for public health systems globally. Regular exercise improves metabolic health. Pharmacological targeting of exercise mediators might facilitate physical activity or amplify the effects of exercise. The peroxisome proliferator-activated receptor γ coactivator 1α (PGC-1α) largely mediates musculoskeletal adaptations to exercise, including lipid refueling, and thus constitutes such a putative target. Paradoxically, forced expression of PGC-1α in muscle promotes diet-induced insulin resistance in sedentary animals. We show that elevated PGC-1α in combination with exercise preferentially improves glucose homeostasis, increases Krebs cycle activity, and reduces the levels of acylcarnitines and sphingosine. Moreover, patterns of lipid partitioning are altered in favor of enhanced insulin sensitivity in response to combined PGC-1α and exercise. Our findings reveal how physical activity improves glucose homeostasis. Furthermore, our data suggest that the combination of elevated muscle PGC-1α and exercise constitutes a promising approach for the treatment of metabolic disorders.


Figures

FIG. 1.
FIG. 1.
Whole-body and muscle glucose homeostasis. Glucose tolerance test (GTT) excursion curves (A) and corresponding area under the curve (B). Insulin tolerance test (ITT) excursion curves (C) and corresponding area under the curve (D). E: Relative gene expression of mediators of glucose uptake in skeletal muscle assessed by real-time (RT)-PCR. F: Glucose uptake into isolated skeletal muscle measured by the 2-deoxyglucose technique. G: IRS-1-associated muscle PI3K activity. All values are expressed as mean ± SE (n = 8 per group). @Effect of genotype (wild-type [wt] vs. MPGC-1α TG). #Effect of training (sedentary [sed] vs. exercised [ex]). xGenotype times training interaction as assessed by ANOVA. Comparison between two individual groups: *Effects of training (sed vs. ex) and §Genotype (wt vs. MPGC-1α TG mice) were assessed by t test. One symbol indicates P < 0.05, two symbols indicate P < 0.01, and three symbols indicate P < 0.001. HKII, hexokinase II.
FIG. 2.
FIG. 2.
Lipid uptake. Relative mRNA expression of lipoprotein lipase (LPL) (A) and cluster of differentiation 36 (CD36) (B) in MPGC-1α TG mice and control littermates. All values are expressed as mean ± SE (n = 8 per group). @Effect of genotype (wild-type [wt] vs. MPGC-1α TG). #Effect of training (sedentary [sed] vs. exercised [ex]). xGenotype times training interaction as assessed by ANOVA. Comparison between two individual groups: *Effects of training (sed vs. ex) and §Genotype (wt vs. MPGC-1α TG mice) were assessed by t test. One symbol indicates P < 0.05, two symbols indicate P < 0.01, and three symbols indicate P < 0.001.
FIG. 3.
FIG. 3.
β-Oxidation, TCA cycle, and acylcarnitines. A: Relative gene expression of regulators of lipid oxidation and the TCA cycle. B: Citrate synthase activity. C: Levels of saturated acylcarnitines (SFAs). D: Levels of monosaturated acylcarnitines (MUFAs). E: Levels of polysaturated acylcarnitines (PUFAs). F: Total carnitine levels. G: Acetylcarnitine levels. All values are expressed as mean ± SE (n = 8 per group). @Effect of genotype (wild-type [wt] vs. MPGC-1α TG). #Effect of training (sedentary [sed] vs. exercised [ex]). xGenotype times training interaction as assessed by ANOVA. Comparison between two individual groups: *Effects of training (sed vs. ex) and §Genotype (wt vs. MPGC-1α TG mice) were assessed by t test. One symbol indicates P < 0.05, two symbols indicate P < 0.01, and three symbols indicate P < 0.001.
FIG. 4.
FIG. 4.
Oxidative phosphorylation and reactive oxygen species. A: Relative gene expression of elements of oxidative phosphorylation. B: Succinate dehydrogenase (SDH; upper panel), cytochrome c oxidase (Cox; middle panel), and Mitotracker green staining (lower panel). C: Relative gene expression of ROS detoxifying enzymes. D: H2O2 levels in skeletal muscle. All values are expressed as mean ± SE (n = 8 per group). @Effect of genotype (wild-type [wt] vs. MPGC-1α TG). #Effect of training (sedentary [sed] vs. exercised [ex]). xGenotype times training interaction as assessed by ANOVA. Comparison between two individual groups: *Effects of training (sed vs. ex) and §Genotype (wt vs. MPGC-1α TG mice) were assessed by t test. One symbol indicates P < 0.05, two symbols indicate P < 0.01, and three symbols indicate P < 0.001. CAT, catalase; Gpx, glutathione peroxidase; UCP3, uncoupling protein 3; ANT, adenine nucleotide translocator; SOD, superoxide dismutase.
FIG. 5.
FIG. 5.
Muscle lipid species. G6PDH activity (A) and FAS activity (B). C: TAGs. D: DAGs. E: Ceramide. F: Phosphatidylcholine. G: Phosphatidylethanolamine. H: Sphingosine. All values are expressed as mean ± SE (n = 8 per group). @Effect of genotype (wild-type [wt] vs. MPGC-1α TG). #Effect of training (sedentary [sed] vs. exercised [ex]). xGenotype times training interaction as assessed by ANOVA. Comparison between two individual groups: *Effects of training (sed vs. ex) and §Genotype (wt vs. MPGC-1α TG mice) were assessed by t test. One symbol indicates P < 0.05, two symbols indicate P < 0.01, and three symbols indicate P < 0.001.
FIG. 6.
FIG. 6.
Metabolic regulation of glucose uptake in skeletal muscle. A: Effect of the FAS inhibitor cerulenin on glucose uptake in the absence (white bars) or presence (black bars) of insulin. B: Effect of the sphingosine on glucose uptake in the absence (white bars) or presence (black bars) of insulin. All values are expressed as mean ± SE (n = 6 per group). @Effect of genotype (wild-type [wt] vs. MPGC-1α TG). #Effect of training (sedentary [sed] vs. exercised [ex]). xGenotype times training interaction as assessed by ANOVA. Comparison between two individual groups: *Effects of training (sed vs. ex) and §Genotype (wt vs. MPGC-1α TG mice) were assessed by t test. One symbol indicates P < 0.05, two symbols indicate P < 0.01, and three symbols indicate P < 0.001. GFP, green fluorescent protein.
FIG. 7.
FIG. 7.
Integrative theoretical model. Schematic theoretical interpretation of the findings on metabolic profiles predominating in response to training and PGC-1α levels. Sedentary state: At elevated levels of PGC-1α, the increase in β-oxidation relatively exceeds the increase in citrate synthase activity. Consequently, acetylcarnitine accumulates and impairs insulin sensitivity. Citrate, produced by citrate synthase, is fueled into OXPHOS to generate ATP. In the absence of physical activity, the low ATP turnover ultimately limits OXPHOS activity and directs metabolic fluxes away from catabolism. The elevated citrate synthase activity, without an elevated need to produce ATP for muscle contraction, overloads the Krebs cycle. Citrate is consequently exported into the cytoplasm and promotes de novo lipogenesis through FAS. De novo synthesized fatty acids are subsequently fueled back into lipid oxidation or incorporated into higher lipid species. They then exert distinct effects on glucose homeostasis. DAG, PC, and PE are used to expand mitochondrial mass without impact on glucose homeostasis while sphingosine (Sph) inhibits glucose uptake. Exercised state: At elevated levels of PGC-1α, citrate synthase activity further increases and the levels of acetylcarnitine diminish. Citrate is shunted toward catabolic and anabolic pathways. Acutely, the high turnover of ATP during muscle contraction drives further flux of lipids into the catabolic system. Chronically, endurance training further promotes lipid synthesis and storage as triglycerides. The combination of exercise and elevated muscle PGC-1α consequently results in an elevated activity of lipid synthesis and a concomitant increase in TG, DAG, PC, and PE. Thus, lipid fluxes are diverted away from sphingosine toward triglyceride biosynthesis. Moreover, the elevated levels of TG inhibit the action of sphingosine and relieve any inhibitory effect. The high FAS activity will drive glucose uptake into skeletal muscle and thus removal of glucose from the circulation. Dashed arrows/lines, basal conditions; straight arrows/lines, altered at elevated PGC-1α levels or exercise; light arrows/lines, chronic elevation; dark arrows/lines, additional elevation during acute exercise; red boxes/lines, insulin-desensitizing metabolites; blue boxes/lines, neutral metabolites in respect to insulin sensitivity. PC, phosphatidylcholine; PE, phosphatidylethanolamine.

Comment in

References

    1. Bogers RP, Barte JC, Schipper CM, et al. Relationship between costs of lifestyle interventions and weight loss in overweight adults. Obes Rev 2010;11:51–61 - PubMed
    1. Kopelman PG. Obesity as a medical problem. Nature 2000;404:635–643 - PubMed
    1. Lau DC, Douketis JD, Morrison KM, Hramiak IM, Sharma AM, Ur E, Obesity Canada Clinical Practice Guidelines Expert Panel 2006 Canadian clinical practice guidelines on the management and prevention of obesity in adults and children [summary]. CMAJ 2007;176:S1–S13 - PMC - PubMed
    1. Kahn BB, Alquier T, Carling D, Hardie DG. AMP-activated protein kinase: ancient energy gauge provides clues to modern understanding of metabolism. Cell Metab 2005;1:15–25 - PubMed
    1. Zhang BB, Zhou G, Li C. AMPK: an emerging drug target for diabetes and the metabolic syndrome. Cell Metab 2009;9:407–416 - PubMed

Publication types