. 2012 Nov;14(11):1212-22.
doi: 10.1038/ncb2607. Epub 2012 Oct 21.

Elf5 inhibits the epithelial-mesenchymal transition in mammary gland development and breast cancer metastasis by transcriptionally repressing Snail2

Affiliations

Elf5 inhibits the epithelial-mesenchymal transition in mammary gland development and breast cancer metastasis by transcriptionally repressing Snail2

Rumela Chakrabarti et al. Nat Cell Biol. 2012 Nov.

Abstract

The epithelial-mesenchymal transition (EMT) is a complex process that occurs during organogenesis and in cancer metastasis. Despite recent progress, the molecular pathways connecting the physiological and pathological functions of EMT need to be better defined. Here we show that the transcription factor Elf5, a key regulator of mammary gland alveologenesis, controls EMT in both mammary gland development and metastasis. We uncovered this role for Elf5 through analyses of Elf5 conditional knockout animals, various in vitro and in vivo models of EMT and metastasis, an MMTV-neu transgenic model of mammary tumour progression and clinical breast cancer samples. Furthermore, we demonstrate that Elf5 suppresses EMT by directly repressing the transcription of Snail2, a master regulator of mammary stem cells and a known inducer of EMT. These findings establish Elf5 not only as a key cell lineage regulator during normal mammary gland development, but also as a suppressor of EMT and metastasis in breast cancer.


Conflict of interest statement

COMPETING FINANCIAL INTERESTS

The authors declare no competing financial interests.

Figures

Figure 1
Figure 1. Loss of Elf5 in the mouse mammary gland results in an EMT-like phenotype during pregnancy and lactation
Analysis of the mouse mammary epithelium from wild type and Elf5-KO mice (n=5) revealed loss of E-cadherin (a–f), up-regulation of Vimentin (g–l) and nuclear Snail2 (m–r) in luminal epithelial cells during different stages of pregnancy. P12.5 in a, b, g, h, m, n; P17.5 in c, d, i, j, o, p; Lac1 in e, f, k, l, q, r. Arrows indicate areas with loss of E-cadherin and arrowheads indicate areas with normal E-cadherin expression in af. Inset in f shows adjacent mammary epithelium with normal expression of E-cadherin. White arrows in g–l show abnormal Vimentin expression in luminal epithelial cells. Black arrows in m–r show normal Snail2 protein localization in basal epithelial cells. Size bar = 40 μm in a–f, m–r and 18 μm in g–l.
Figure 2
Figure 2. Loss of Elf5 leads to increased EMT gene expression programs
(a) Heat map representation of microarray data displaying the expression of several key EMT-related genes in wild type and Elf5-KO mammary glands on lactation day 1. (b) GSEA data showing the enrichment of four published EMT gene signatures- in Elf5-KO mammary glands as compared to wild type glands. NES: normalized enrichment score. (c, e) Western blot analyses of HA-Elf5 and E-cadherin protein levels in NMuMG cells transduced with vector (control) or HA-Elf5. Uncropped images of blots are shown in Supplementary Fig. S9. (d) Phase contrast and E-cadherin immunofluorescence images of NMuMG (control) or NMuMG-Elf5 cells undergoing TGFβ-induced EMT when cultured in low cell density. Experiments using cells cultured in high density are shown in Supplementary Fig. S1i. Size bar = 100 μm for brightfield and 40 μm for E-cadherin. (f) qRT-PCR analysis of expression of EMT-related genes in NMuMG (control) or NMuMG-Elf5 cells, with or without TGFβ treatment. Real time PCR values were normalized to the housekeeping gene Gapdh. Experiments were performed three times, each with qRT-PCR in technical duplicate, and data presented as the mean ± SD. * p < 0.05 by Student’s t-test.
Figure 3
Figure 3. Silencing of ELF5 induces EMT in T47D cells and increases migratory potential
(a, b) Quantitative RT-PCR analysis of ELF5 and EMT-related genes in T47D cells treated with control or ELF5 siRNA at low (a) or high (b) cellular density. Real time PCR values were normalized to the housekeeping gene GAPDH. Experiments were performed three times, each with qRT-PCR in technical duplicate, and data presented as the mean ± SD. * p < 0.05 by Student’s t-test. (c) Western blot analysis of ELF5 and EMT markers in T47D cells treated with control or ELF5 siRNA. Uncropped images of blots are shown in Supplementary Fig. S9. (d) Phase contrast and immunofluoresence images of control or ELF5-knockdown T47D cells stained for E-CADHERIN, β-CATENIN, and F-ACTIN. Loss of F-actin circumferential belts (arrows) and relocalization of β-CATENIN from adherens junctions of the membrane (arrows) to cytoplasm are highlighted with arrowheads. Size bar = 100 μm for brightfield images and β-CATENIN, and 20 μm for E-CADHERIN and 18 μm for F-actin. See Supplementary Fig. S3a which shows the unchanged morphology of T47D cells after mock transfection. (e) Transwell migration assay of T47D cells with or without ELF5 knockdown. The data represented are shown as mean ± SD collected from 6 fields of 3 independent experiments. Student’s t-tests were performed to assess statistical significance.
Figure 4
Figure 4. Overexpression of Elf5 reverses mesenchymal characteristics of MDA-231 cells
(a) Western blot analyses of HA-Elf5 and other EMT markers in MDA-231 cells transduced with vector (control) or HA-Elf5. Uncropped images of blots are shown in Supplementary Fig. S9. (b) Phase contrast images of parental, control or HA-Elf5-overexpressing MDA-231cells. Size bar = 100 μm. (c) Immunofluorescence analysis of control and HA-Elf5-overexpressing MDA-231 cells stained for the indicated proteins. Arrows mark the relocalization of nuclear β-CATENIN to the membrane and cytoplasm, restoration of circumferential F-actin belts, membrane localization of ZO-1 and adherens junctions, and reduced expression of VIMENTIN in Elf5-overexpressing cells. Size bar = 20 μm for β-CATENIN, and F-ACTIN, 60 μm for E-CADHERIN, and 40 μm for ZO-1 and VIMENTIN. (d, e) Quantitative RT-PCR analysis of the expression of EMT-related genes in control or HA-Elf5-overexpressing MDA-231 cells at 12 days (d) or 48h post-infection (e). Real time values were normalized to the housekeeping gene GAPDH. Experiments were performed three times, each with qRT-PCR in technical duplicate, and data presented as the mean ± SD. * p < 0.05 by Student’s t-test. (f) Transwell migration assay of MDA-231 cells with or without Elf5 overexpression. The data are shown as mean ± SD collected from 10 fields of 3 independent experiments. Student’s t-tests were performed to assess statistical significance. (g, h) Matrigel invasion assay of MDA-231 cells with or without Elf5 overexpression. Two time points were observed for invasion assays (24 h in g and 48 h in h). The data were collected from 10 fields, performed in triplicate, and shown as mean ± SD. * p < 0.05 by Student’s t-test.
Figure 5
Figure 5. Elf5 binds to the SNAI2 promoter and represses its expression
(a) Schematic depiction of the SNAI2 promoter with several putative ELF5 binding sites (red boxes) indicated. Primer sets for ChIP analyses are indicated by the arrows in the schematic diagram. (b) Evolutionary conservation of the ELF5 binding motif in the P2 promoter-proximal region of the SNAI2 gene. (c) ChIP analysis of HA-Elf5 binding to the SNAI2 promoter in MDA-231-Elf5 cells. Quantitative PCR was performed with primers specific to seven regions on the SNAI2 promoter as indicated in a. Primers against the -300 bp promoter region (P2) show significant enrichment after normalization to the GAPDH control. Experiments were performed three times, each with qRT-PCR in technical duplicate, and data presented as the mean ± SD. (d) Relative expression of WT or mutant (MT) SNAI2 promoter-driven luciferase reporters in control or Elf5-overexpressing MDA-231 cells. The data represented are shown as mean ± SD collected from 3 independent experiments. (e) Relative expression of a wild type (WT) SNAI2 promoter-driven luciferase reporter in MCF-7 cells transiently transfected with vector control or HA-Elf5 expression plasmids. The data represented are shown as mean ± SD collected from 3 independent experiments. (f) Western blot of Elf5 and SNAIL2 protein levels in MDA-231-Elf5 cells transduced with vector (control) or SNAI2. Uncropped images of blots are shown in Supplementary Fig. S9. (g) Phase contrast images showing morphological characteristics of control, Elf5, or HA-Elf5 and FLAG-SNAIL2 overexpressing MDA-231 cells. Outlined cells demonstrate spindle-like (left and right) or cobblestone-like (middle) morphologies. Size bar = 10 μm (h) Transwell migration assay with control, Elf5, or Elf5 and SNAIL2 overexpressing MDA-231cells. Data are shown as mean ± SD collected from 10 fields of 3 independent experiments. Student’s t-tests were performed to assess statistical significance in c, d, e, and h. * p < 0.05 by Student’s t-test; # p > 0.05.
Figure 6
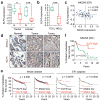
Figure 6. Expression pattern and prognostic values of ELF5 and SNAIL2 in breast tumors
(a) Box plots showing ELF5 expression in laser capture microdissection samples of invasive ductal and lobular carcinomas as compared to normal ductal and lobular cells from matched mammary glands. (b) Box plots showing ELF5 expression in laser capture microdissection samples of hyperplastic enlarged lobular units (HELU) as compared to normal terminal duct lobular units (TDLU). (c) Scatter plot showing negative correlation between SNAI2 and ELF5 expression in ER- patients in the NKI295 clinical dataset. Pearsons’ coefficient tests were performed to assess statistical significance. (d) IHC analysis showing ELF5 expression in luminal cells and SNAIL2 expression only in some basal cells in normal breast tissue (left panel). In human breast tumors, ELF5 and SNAIL2 show inverse correlation in expression (middle and right panels). Size bar = 20 μm. (e) Kaplan-Meier plots of distant metastasis-free survival of patients, stratified by expression of Elf5 or SNAI2. Data obtained from the KM plotter database. p value calculated by log rank test. (f) Kaplan-Meier plots of distant metastasis-free survival of ER- patients stratified by Elf5 expression in the NKI295 clinical dataset. p value calculated by log rank test.
Figure 7
Figure 7. Elf5 inhibits lung metastasis in transplantable mouse models of metastasis
(a) GSEA showing negative enrichment of published EMT gene signatures- in Elf5-LM2 compared to control cells. (b) Transwell migration assay of control or HA-Elf5 overexpressing LM2 cells. Data are shown as mean ± SD from triplicate experiments. *p < 0.05 by Student’s t-test. (c) Normalized BLI signals of lung metastases of mice (n = 8) injected intravenously with control or Elf5-overexpressing LM2 cells. Data represent average ± SEM. *p < 0.05 based on Mann-Whitney U test. (d) Representative BLI images of animals in each experimental group at the indicated time points. (e–f) Gross images (e) and quantification (f) of lung metastatic nodules from animals injected intravenously with control or Elf5-overexpressing LM2 cells. Size bar = 2 mm. **p < 0.01 by Student’s t-test. (g) Box plot showing the number of lung metastasis nodules from spontaneous metastases generated by control or Elf5 overexpressing 4T1 cells after mammary fat pad injection (n=12). p = 0.0455 calculated by Mann-Whitney U test. (h) Representative H&E stained lung sections. Arrows highlight metastatic nodules. Size bar = 2 mm. (i) Box plot showing number of lung metastasis nodules from experimental metastasis of control, HA-Elf5, or HA-Elf5 and FLAG-SNAIL2 overexpressing 4T1 cells. *p < 0.05 by Student t- test. (j) Represented gross images of lung nodules. Size bar = 2 mm.
Figure 8
Figure 8. Elf5 inhibits lung metastasis in MMTV-Neu transgenic mouse model
(a) Primary mammary tumors stained with K14 and K8 or Snail2 from WT/MMTV-Neu+ or Elf5-KO/MMTV-Neu+ animals. Bar = 40 μm. (b–d) Lung metastasis incidence (b), number of lung metastasis lesions (c) and average lung lesion surface area (d) (arbitrary units based on pixel quantification from digital images, the data represented are shown as mean ± SD) from WT/MMTV-Neu+, Elf5-Het/MMTV-Neu+ and Elf5-cKO/MMTV-Neu+ animals (n = 11). p = 0.141 by Fisher Exact test in b. p = 0.020 by Mann Whitney test in c. p =0.025 by Student’s t-test in d. (e) Snail2 staining in lung lesions from WT/MMTV-Neu+ or Elf5-KO/MMTV-Neu+ mice. Size bar = 2 mm and 40 μm for lung H & E and Snail2 IHC images respectively. (f) Schematic model for function of the Elf5-Snail2 axis in mammary cell fate regulation and breast cancer metastasis. During luminal differentiation of mammary epithelium, high expression of Elf5 in the differentiated luminal lineage suppresses Snail2 expression to inhibit mammary stem and progenitor cell properties (left). Low expression or loss of Elf5 allows Snail2 to induce EMT and increases Snail2-dependent stem and progenitor activities in the mammary gland (left), and promotes breast cancer invasion, metastasis, and potentially tumor initiating cell properties (right).

Comment in

  • Metastasis: Elf represses snail.
    McCarthy N. McCarthy N. Nat Rev Cancer. 2012 Dec;12(12):795. doi: 10.1038/nrc3406. Nat Rev Cancer. 2012. PMID: 23175114 No abstract available.

References

    1. Thiery JP, Sleeman JP. Complex networks orchestrate epithelial-mesenchymal transitions. Nat Rev Mol Cell Biol. 2006;7:131–142. - PubMed
    1. Yang J, Weinberg RA. Epithelial-mesenchymal transition: at the crossroads of development and tumor metastasis. Dev Cell. 2008;14:818–829. - PubMed
    1. Lee JM, Dedhar S, Kalluri R, Thompson EW. The epithelial-mesenchymal transition: new insights in signaling, development, and disease. The Journal of cell biology. 2006;172:973–981. - PMC - PubMed
    1. Thiery JP, Acloque H, Huang RY, Nieto MA. Epithelial-mesenchymal transitions in development and disease. Cell. 2009;139:871–890. - PubMed
    1. Acloque H, et al. Reciprocal repression between Sox3 and snail transcription factors defines embryonic territories at gastrulation. Dev Cell. 2011;21:546–558. - PMC - PubMed

Publication types

MeSH terms