. 2013 Jan;121(1):97-104.
doi: 10.1289/ehp.1205374. Epub 2012 Oct 19.

Heavy metal lead exposure, osteoporotic-like phenotype in an animal model, and depression of Wnt signaling

Affiliations

Heavy metal lead exposure, osteoporotic-like phenotype in an animal model, and depression of Wnt signaling

Eric E Beier et al. Environ Health Perspect. 2013 Jan.

Erratum in

  • Environ Health Perspect. 2013 Feb;121(2):a43

Abstract

Background: Exposure to lead (Pb) from environmental and industrial sources remains an overlooked serious public health risk. Elucidating the effect of Pb on bone cell function is therefore critical for understanding its risk associated with diseases of low bone mass.

Objectives: We tested the hypothesis that Pb negatively affects bone mass. We also assessed the underlying mechanisms of Pb on bone signaling pathways.

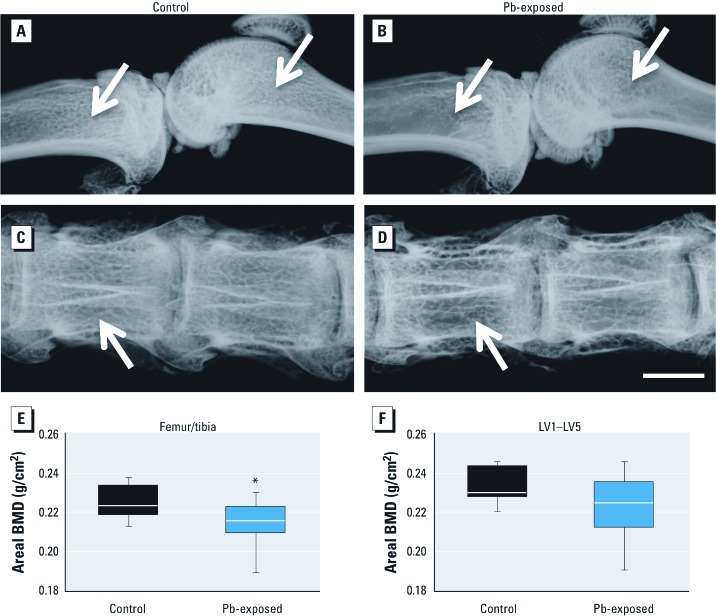
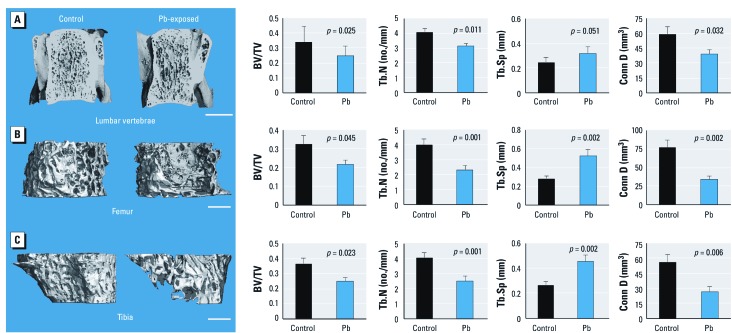
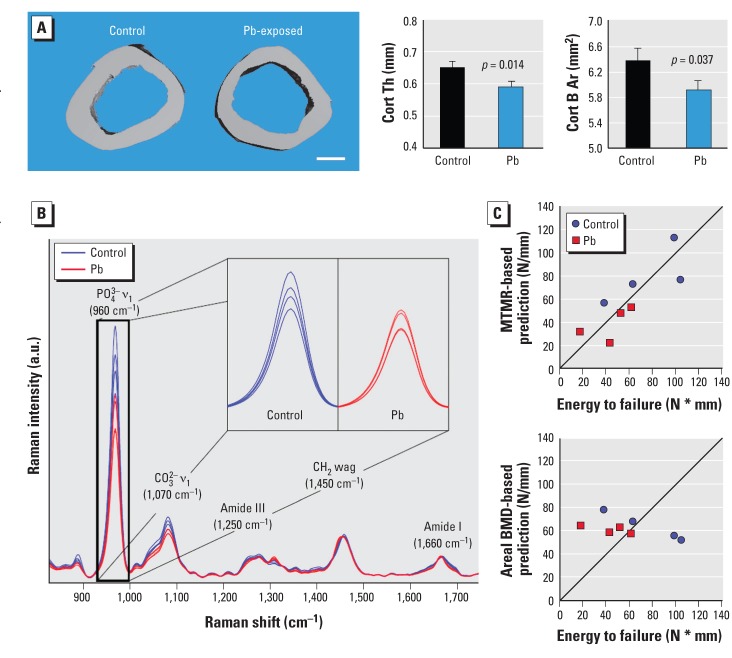
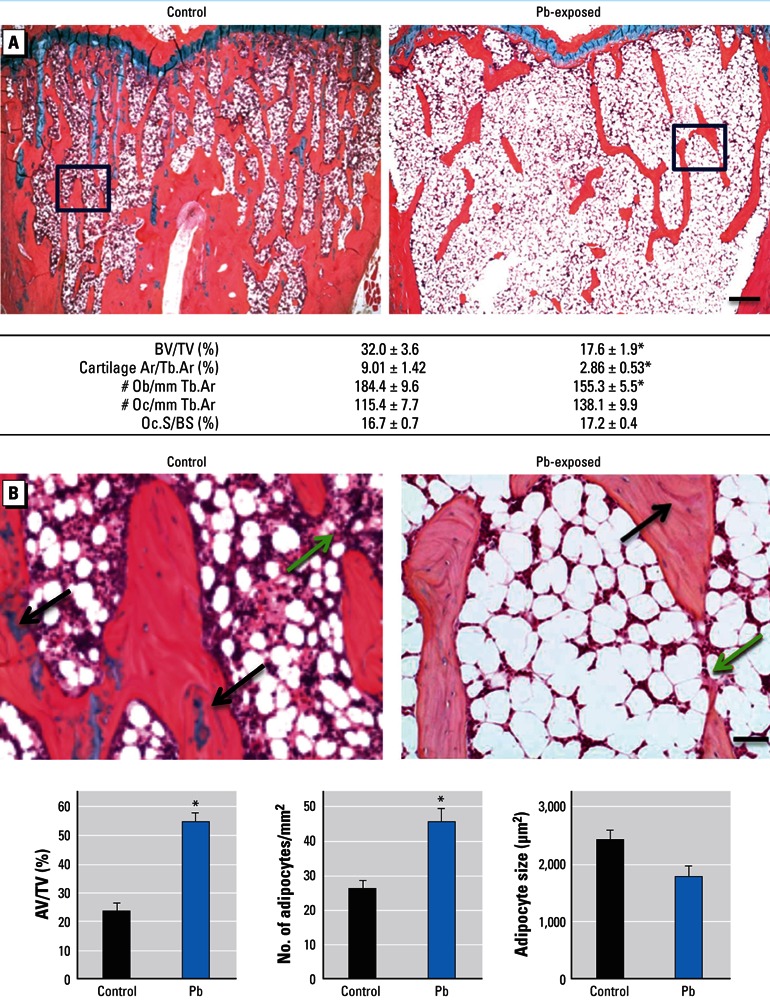
Methods: We used a model of low-level Pb exposure in a rodent beginning before conception and continuing over 18 months. We characterized the effect of Pb on bone quality using dual-energy X-ray absorptiometry (DXA), micro-computed tomography, Raman spectroscopy, and histology. We assessed the effect of Pb on bone and adipocyte formation by mineral deposition, lipid droplet formation, and Western blot and RNA analysis.

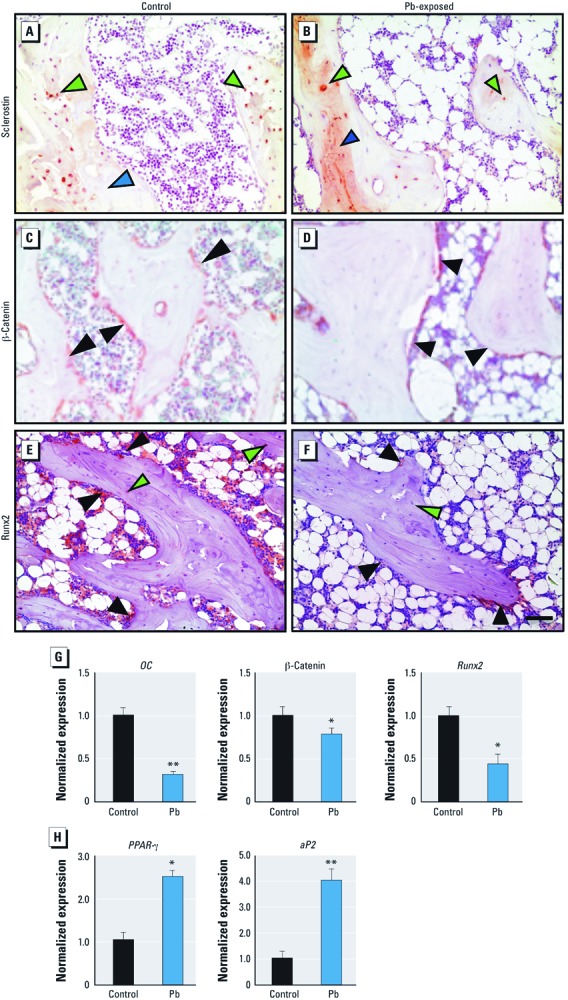
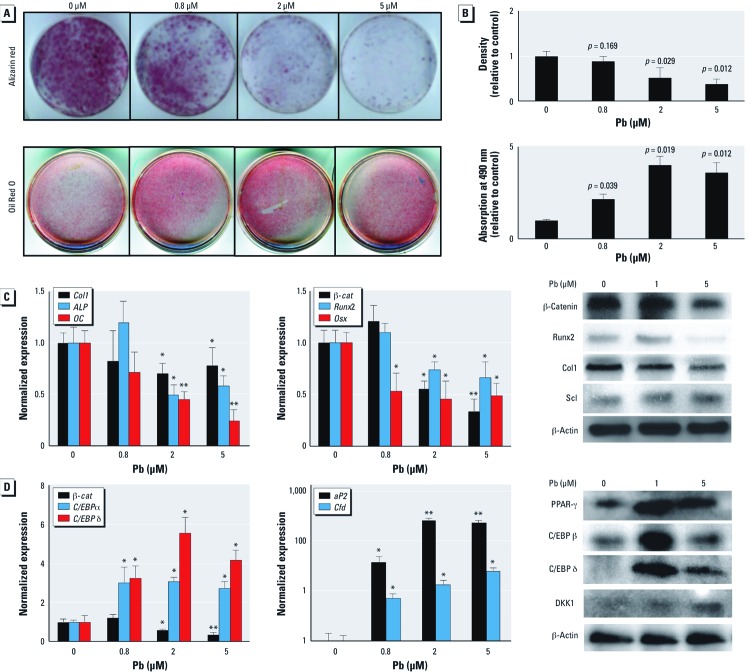
Results: Pb-exposed animals had decreased bone mass that resulted in bones that were more susceptible to fracture. Pb decreased osteoblastic cell number leading to a depression of bone formation. Accompanying this, Pb exposure elevated sclerostin protein levels in the skeleton, and correspondingly reduced levels of β-catenin and Runx2 in stromal precursor cells. Pb also increased skeletal expression of peroxisome proliferator-activated receptor-γ (PPAR-γ). These results indicate a shift in mesenchymal differentiation wherein Pb promoted enhanced adipogenesis and decreased osteoblastogenesis. Substantial differences in bone marrow composition were observed, highlighted by an increase in adipocytes.

Conclusions: The disruption Pb has on bone mass and bone homeostasis is principally explained by inhibition of the Wnt/β-catenin pathway, which may provide a molecular basis for novel therapeutic strategies to combat Pb-induced bone pathologies.


Conflict of interest statement

The authors declare they have no actual or potential competing financial interests.

Figures

Figure 1
Figure 1
Pb exposure decreased bone mineral density in long bones and lumbar vertebrae of rats continuously exposed to 50 ppm Pb in drinking water. Radiographic images of femur/tibia (A,B) and vertebrae (C,D) taken ex vivo from randomly selected rats are representative of each treatment group. Radiolucency in the trabecular region (arrows) is prominent in Pb-exposed rats (B,D) but is absent in control animals (A,C). Bar = 2.5 mm. DXA scans detected lower areal BMD in both leg (E) and spine (F) of Pb-exposed rats. Data represent mean ± SE (n = 9 rats/group). *p < 0.05.
Figure 2
Figure 2
Rats exposed to 50 ppm Pb in drinking water showed a systemic decrease in trabecular bone volume. We analyzed trabecular bone properties in the LV3 (A), the distal femur (B) and the proximal tibia (C). Images (left) are representative transverse sections from control and Pb-exposed rats and were selected based on the median BV/TV; bars = 2.5 mm (A) and 1 mm (B,C). Quantitative analysis (right) shows significant changes in BV/TV, Tb.N, Tb.Sp, and Conn D. Data are mean ± SE (n = 9 rats/group).
Figure 3
Figure 3
Bone properties at the femoral midshaft were altered in rats exposed to 50 ppm Pb in drinking water. (A) Results of micro-CT analysis of rat femurs. (Left) Cross-sectional images representative of treatment group (bar = 1 mm); (right) cortical thickness (Cort Th) and bone area (Cort B Ar). (B) Average Raman spectrum acquired from each femur, with the difference in phosphate chemical peaks expanded; Raman intensity is shown in arbitrary units (a.u.). (C) Scatter plots show the MTMR‑based (top) and areal BMD‑based (bottom) predictions of the energy to failure for each femur versus its measured value [Newtons per millimeter (N/mm)] [see Supplemental Material, Table S3 (http://dx.doi.org/10.1289/ehp.1205374)]. Data represent mean ± SE for 9 rats/group (A) and 4 rats/group (B,C).
Figure 4
Figure 4
Changes in bone and adipogenic histomorphometric parameters in Pb-exposed rats compared with controls. (A) Sections of trabecular bone in the metaphyseal region of proximal tibia from control and Pb-treated rats (top) were evaluated for the following bone properties (bottom): BV/TV, cartilage area to trabecular area (Cartilage Ar/Tb.Ar), osteoblast number to trabecular area (Ob/Tb.Ar), osteoclast number to trabecular area (Oc/Tb.Ar), and osteoclast surface to bone surface (Oc.S/BS). (B) Images magnified from areas indicated by black boxes in (A) show fatty bone marrow changes in rat tibia (top). Green arrows highlight areas of unfilled tunneling and resorption space in Pb exposures, and black arrows indicate cartilage bars in trabecular bone. Bone sections were evaluated for adipocyte content (bottom). AV/TV, adipose volume to total volume. Data represent mean ± SE (n = 4 rats/group). Bar = 100 µm in (A) and 500 µm in (B). *p < 0.05.
Figure 5
Figure 5
Pb decreases osteogenesis by up-regulation of sclerostin and corresponding suppression of Wnt signaling and osteoblastic genes while also increasing adipogenesis. (A–F) Representative immunohistochemical staining for sclerostin (A,B), β-catenin (C,D), and RunX2 (E,F) proteins in proximal tibia of control (A,C,E) and Pb-exposed (B,D,F) rats. Green arrows indicate osteocytes, black arrows indicate stromal cells, and blue arrows highlight bone matrix (bar = 500 µm). Expression of osteocalcin, β-catenin, and Runx-2 (G), as well as PPAR-γ and aP2 (H) mRNA from isolated total RNA in rat tibias using RT-PCR. Data represent mean ± SE (n = 4 rats/group). *p < 0.05. **p < 0.005.
Figure 6
Figure 6
Pb increases the adipogenic potential of C3H10t1/2 mouse embryonic mesenchymal cells and suppresses osteoblast differentiation by corresponding reduction of Wnt signaling. Calvarial osteoblasts and C3H10t1 cells were treated with 0 (control), 0.8, 2, and 5 µM Pb. (A) Pb dose-dependently inhibited mineralization of primary osteoblasts, as seen with alizarin red stain (top), and increased the adipogenic potential in C3H10t1/2 cells treated with an adipogenic cocktail and stained with Oil Red O (bottom). (B) Quantification of staining shown in (A). (C,D) Results of RT‑PCR and Western blots showing expression profiles of osteoblastic genes and protein levels after 10 days of Pb exposure (C) and expression profiles of adipogenic genes and protein levels after 5 days of Pb exposure (D). Data represent mean ± SE for three trials. *p < 0.05 **p < 0.005.

Similar articles

Cited by

References

    1. Bagchi D, Preuss HG. Effects of acute and chronic oval exposure of lead on blood pressure and bone mineral density in rats. J Inorg Biochem. 2005;99(5):1155–1164. - PubMed
    1. Barth RW, Williams JL, Kaplan FS. Osteon morphometry in females with femoral neck fractures. Clin Orthop Relat Res. 1992;283:178–186. - PubMed
    1. Campbell JR, Auinger P. The association between blood lead levels and osteoporosis among adults—results from the Third National Health and Nutrition Examination Survey (NHANES III). Environ Health Perspect. 2007;115:1018–1022. - PMC - PubMed
    1. Carmouche JJ, Puzas JE, Zhang X, Tiyapatanaputi P, Cory-Slechta DA, Gelein R, et al. Lead exposure inhibits fracture healing and is associated with increased chondrogenesis, delay in cartilage mineralization, and a decrease in osteoprogenitor frequency. Environ Health Perspect. 2005;113:749–755. - PMC - PubMed
    1. Centers for Disease Control and Prevention. Preventing Lead Poisoning in Young Children. Atlanta, GA:Centers for Disease Control and Prevention. 1991. Available: http://www.cdc.gov/nceh/lead/publications/prevleadpoisoning.pdf [accessed 27 November 2012]

Publication types