. 2013:950:373-94.
doi: 10.1007/978-1-62703-137-0_21.

Near-field scanning optical microscopy for high-resolution membrane studies

Affiliations

Near-field scanning optical microscopy for high-resolution membrane studies

Heath A Huckabay et al. Methods Mol Biol. 2013.

Abstract

The desire to directly probe biological structures on the length scales that they exist has driven the steady development of various high-resolution microscopy techniques. Among these, optical microscopy and, in particular, fluorescence-based approaches continue to occupy dominant roles in biological studies given their favorable attributes. Fluorescence microscopy is both sensitive and specific, is generally noninvasive toward biological samples, has excellent temporal resolution for dynamic studies, and is relatively inexpensive. Light-based microscopies can also exploit a myriad of contrast mechanisms based on spectroscopic signatures, energy transfer, polarization, and lifetimes to further enhance the specificity or information content of a measurement. Historically, however, spatial resolution has been limited to approximately half the wavelength due to the diffraction of light. Near-field scanning optical microscopy (NSOM) is one of several optical approaches currently being developed that combines the favorable attributes of fluorescence microscopy with superior spatial resolution. NSOM is particularly well suited for studies of both model and biological membranes and application to these systems is discussed.


Figures

Fig. 1
Fig. 1
A magnified view of a typical aluminum-coated NSOM probe fabricated using the heating and pulling method. A small spot of light can be seen emerging from the distal end of the probe. The probe has been fabricated with a double taper geometry which, for general NSOM imaging, strikes a balance between light throughput and small aperture size.
Fig. 2
Fig. 2
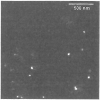
NSOM fluorescence image of a 2 μm × 2 μm region of a DPPC monolayer doped with the fluorescent lipid marker DilC18. Each emission feature represents fluorescence from a single probe molecule in the membrane and has a FWHM of ~20–30 nm. This illustrates the high spatial resolution and single molecule detection limits of NSOM. Because the reporter molecule is much smaller than the NSOM probe, the FWHM of each emission feature reflects the size of the particular NSOM aperture used in the imaging.
Fig. 3
Fig. 3
(a) A fiber-chuck is used to hold the NSOM probe in the evaporative coater. The extra length of fiber from the NSOM probe is sealed inside the spin-chuck with a removable metal ring. (b) Four rotating mounts position the fiber chucks above a central opening, housing the thermal aluminum evaporation element. Mounted above the rotating tips is a quartz crystal microbalance to measure deposition rate and total film thickness. (c) The aluminum evaporation element is surrounded by a metal housing to reduce heating experienced at the tips. A manual shutter is used to block the source when melting and degassing the Al before coating the tips. (d) A metal jacket is glued to an aluminum-coated NSOM probe to assist in mounting the tip in the NSOM head.
Fig 4
Fig 4
μm × 2 μm AFM images of the aluminum coatings applied to NSOM probes in vacuums of (a) 1 × 10⁻³ Torr and (b) 3 × 10⁻⁶ Torr. As seen in these images, a decrease in the chamber pressure results in a considerable decrease in roughness of the Al coating. Figures (c) and (d) show similar AFM measurements on NSOM tip coatings deposited at rates of 30 Å/s and 2,000 Å/s, respectively. These results show that the quality of the Al coating also depends on the rate of deposition, with faster rates preferable over slow depositions. Adapted from ref. 20 with permission.
Fig. 5
Fig. 5
A scanning electron microscopy image of a NSOM probe fabricated using optimal conditions outlined in the text.
Fig. 6
Fig. 6
A NSOM instrument constructed on an inverted fluorescence microscope. The NSOM head contains the z-piezo to control the tip–sample gap and the shear-force feedback detection system. The head is mounted in a motorized dovetail for coarse adjustment of the head toward the sample. The sample is mounted below on a closed-loop xy piezo stage that scans the sample under the probe. Fluorescence from the sample is collected through the microscope, passed through emission filters, and imaged onto the active area of an avalanche photodiode (APD) detector.
Fig. 7
Fig. 7
The NSOM head is used to control the z-position of the near-field probe using a shear-force feedback mechanism. The probe is mounted onto a piezo bimorph held at the end of a z-piezo tube. The bimorph is used to dither the NSOM probe laterally at its resonance frequency. The probe oscillation amplitude is monitored from the side by using a fiber-coupled laser source that shadows the tip onto a split photodiode detector. Each region of the detector is amplified and sent to the differential input of a lock-in amplifier referenced to the tip oscillation frequency.
Fig. 8
Fig. 8
Simultaneously collected NSOM topography (a) and fluorescence (b) images of a DPPC monolayer doped with the fluorescent membrane probe DilC18. Small ~8 Å level height differences observed in the topography image reflect the coexisting liquid-expanded (LE) and liquid-condensed (LC) phases. The bright regions in the NSOM fluorescence image mark the LE domains which incorporate the fluorescent lipid probe. Adapted from ref. 31 with permission.
Fig. 9
Fig. 9
(a) AFM topography image of a DPPC bilayer membrane on a mica substrate formed using the Langmuir-Blodgett/Langmuir-Schäefer (LB/LS) technique. The 10 μm × 10 μm region shows three quantized height levels due to the stacking of liquid-expanded (LE) and liquid-condensed (LC) from each leaflet. The convolution of height information from each leaflet forming the bilayer makes it impossible to assign the phase structure present in each leaflet. NSOM topography (b) and fluorescence (c) images on a similar bilayer, however, can be used to measure the phase distribution in each side of the lipid bilayer by controlling which leaflet incorporates the fluorescent probe. While the NSOM topography (b) suffers the same convolution problem that AFM has, the NSOM fluorescence image (c) shows distinct structures reflective of coexisting lipid phases similar to the monolayer shown in Fig. 8. (All images are 10 μm × 10 μm.) Adapted from ref. 31 with permission
Fig. 10
Fig. 10
23 μm × 23 μm NSOM topography (a) and fluorescence (b) images of a monolayer of the replacement lung surfactant Survanta. The surfactant has been compressed beyond the collapse pressure which has resulted in buckling of the monolayer. This is evident from the change in topography in the force image and corresponding transition in phase structure observed in the NSOM fluorescence image. (Both images are 23 μm × 23 μm.) Adapted from ref. 37 with permission.
Fig. 11
Fig. 11
2 μm × 2 μm AFM image of the nuclear envelope from oocytes of Xenopus laevis The donut-like structures observed in the membrane represent nuclear pore complexes (NPC) which form the only direct pathway across the membrane. A mass is observed in the pore region of many of the NPCs. The identity of this mass is the subject of much speculation, but some believe it represents vault complexes localized to the pore. Adapted from ref. 38 with permission.
Fig. 12
Fig. 12
NSOM topography (a) fluorescence (b) and overlay (c) images of the nuclear envelope in which vault complexes have been immunofluorescently labeled. Individual NPCs are observed in the NSOM topography image, albeit with lower resolution than the AFM measurement shown in Fig. 11. Features in the NSOM fluorescence image reflect labeled vault complexes which can be compared directly with the location of NPCs observed in the force image. The overlay image shows the colocalization of NPCs and vault complexes with less than 100 nm resolution. Scale bar in each image is 1 μm. Adapted from ref. 5 with permission.

Similar articles

Cited by

References

    1. Betzig E, Chichester RJ. Single molecules observed by near-field scanning optical microscopy. Science. 1993;262:1422–1425. - PubMed
    1. Betzig E, Isaacson M, Barshatzky H, Lewis A, Lin K. Near-field scanning optical microscopy (NSOM) Proc SPIE-Int Soc Opt Eng. 1988;897:91–99.
    1. Betzig E, Trautman JK. Near-field optics: microscopy, spectroscopy and surface modification beyond the diffraction limit. Science. 1992;257:189–195. - PubMed
    1. Buratto SK. Near-field scanning optical microscopy. Curr Opin Solid State Mater Sci. 1996;1:485–492.
    1. Dickenson NE, Armendariz KP, Huckabay HA, Livanec PW, Dunn RC. Near-field scanning optical microscopy: a tool for nanometric exploration of biological membranes. Anal Bioanal Chem. 2010;396:31–43. - PubMed

Publication types

LinkOut - more resources