. 2012 Dec 14;287(51):42574-87.
doi: 10.1074/jbc.M112.376590. Epub 2012 Oct 18.

Neuron-restrictive silencer factor (NRSF) represses cocaine- and amphetamine-regulated transcript (CART) transcription and antagonizes cAMP-response element-binding protein signaling through a dual NRSE mechanism

Affiliations

Neuron-restrictive silencer factor (NRSF) represses cocaine- and amphetamine-regulated transcript (CART) transcription and antagonizes cAMP-response element-binding protein signaling through a dual NRSE mechanism

Jing Zhang et al. J Biol Chem. .

Abstract

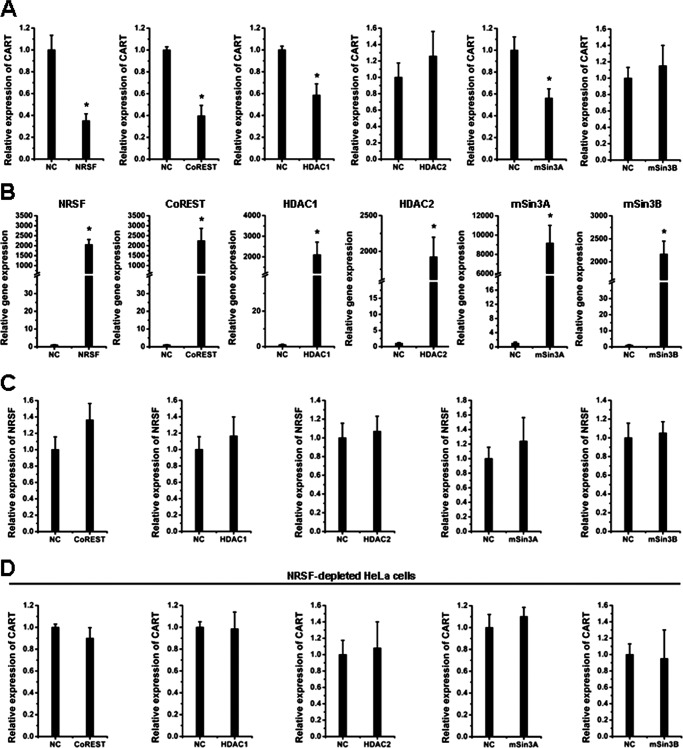
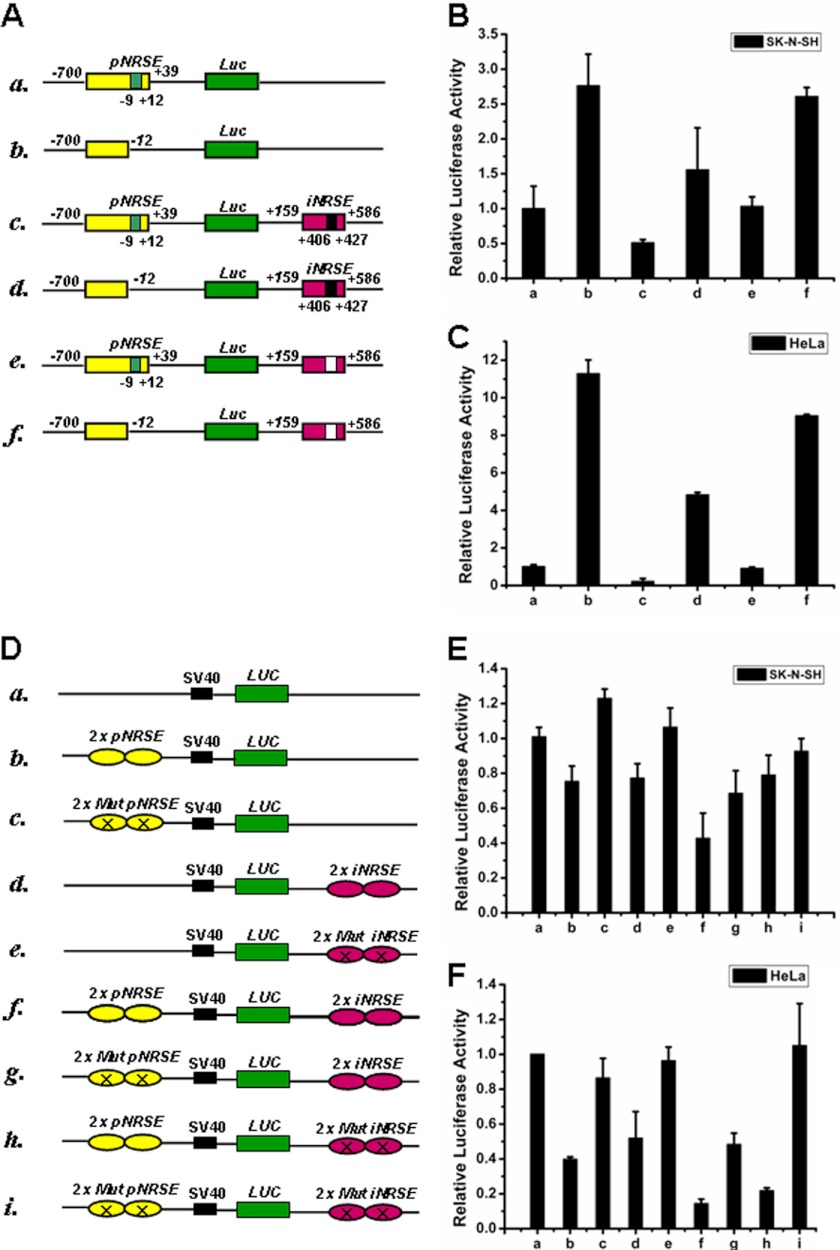
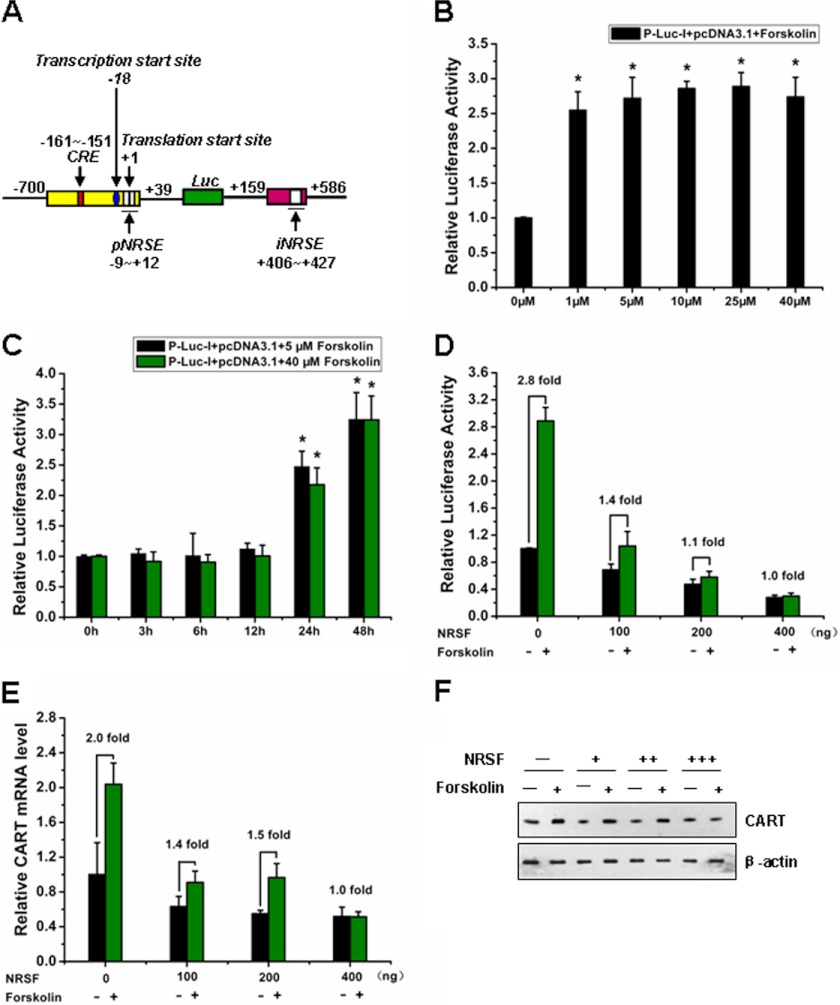
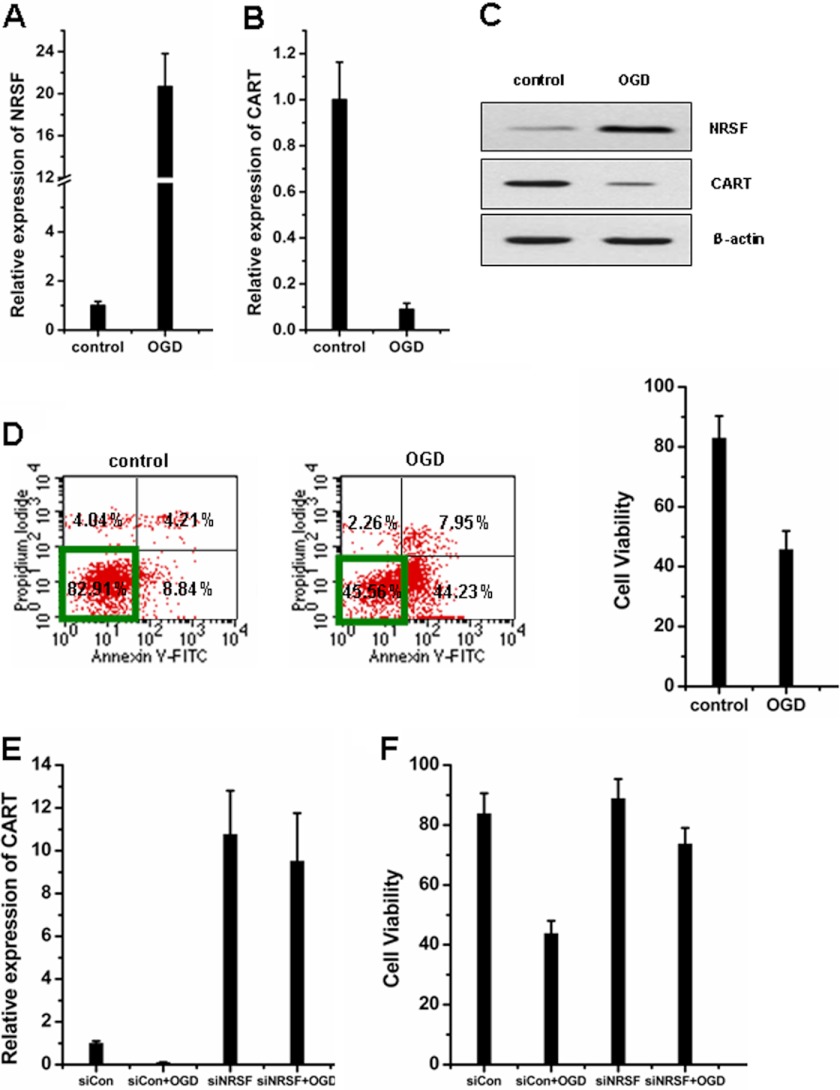
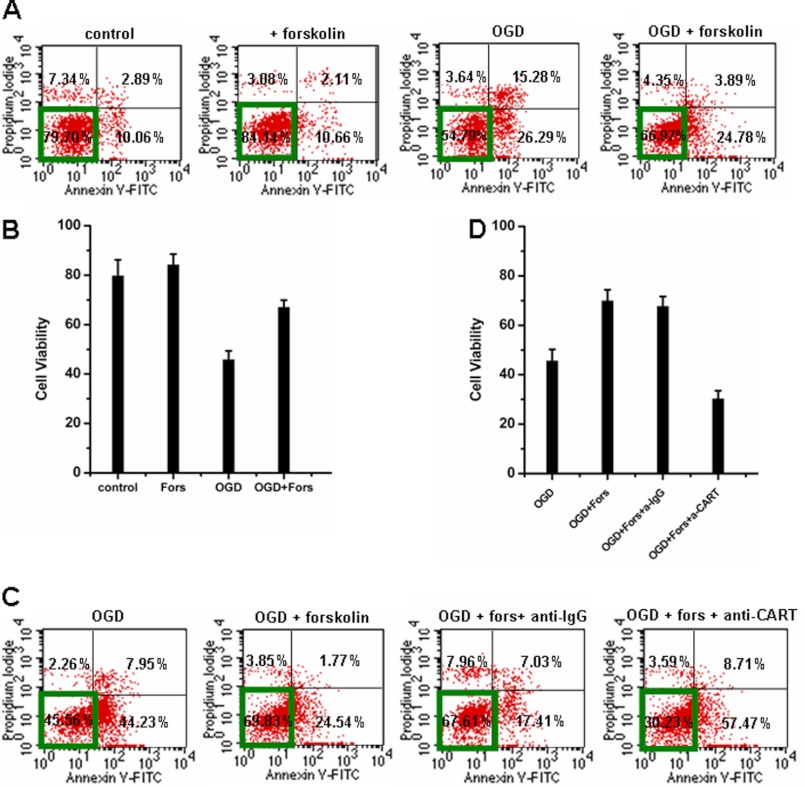
Cocaine- and amphetamine-regulated transcript (CART) peptide plays a pivotal role in neuroprotection against stroke-related brain injury. However, the regulatory mechanism on CART transcription, especially the repression mechanism, is not fully understood. Here, we show that the transcriptional repressor neuron-restrictive silencer elements (NRSF, also known as REST) represses CART expression through direct binding to two NRSF-binding elements (NRSEs) in the CART promoter and intron 1 (named pNRSE and iNRSE, respectively). EMSA show that NRSF binds to pNRSE and iNRSE directly in vitro. ChIP assays show that NRSF recruits differential co-repressor complexes including CoREST and HDAC1 to these NRSEs. The presence of both NRSEs is required for efficient repression of CART transcription as indicated by reporter gene assays. NRSF overexpression antagonizes forskolin-mediated up-regulation of CART mRNA and protein. Ischemia insult triggered by oxygen-glucose deprivation (OGD) enhances NRSF mRNA levels and then NRSF antagonizes the CREB signaling on CART activation, leading to augmented cell death. Depletion of NRSF in combination with forskolin treatment increases neuronal survival after ischemic insult. These findings reveal a novel dual NRSE mechanism by which NRSF represses CART expression and suggest that NRSF may serve as a therapeutic target for stroke treatment.


Figures

FIGURE 1.
FIGURE 1.
NRSF binds to pNRSE and iNRSE of the CART gene in vitro and in vivo. A, NRSE sequences in human, mouse, and rat CART genes. B, EMSA were performed with the nuclear extracts from HeLa cells and the iNRSE and pNRSE probes. C and D, ChIP assays were performed in siRNA-NRSF #1, #2, or siRNA-Control HeLa cells using antibodies against NRSF, HDAC1, HDAC2, mSin3A, mSin3B, CoREST, or control IgG. The immunoprecipitates were analyzed using quantitative real-time PCR with two sets of primers to amplify DNA including iNRSE (C) or pNRSE (D). Ct values of immunoprecipitated samples were normalized to the corresponding value for input. Bars represent mean ± S.D. *, p < 0.05. E, real-time PCR and Western blot analysis were performed to detect the expression levels of NRSF (upper) and CART (lower) in two NRSF-depleted HeLa cell lines (siRNA-NRSF #1, siRNA-NRSF #2). HeLa cells infected with siRNA-control lentivirus were termed the negative control (NC). The results displayed high knockdown efficiency by ∼85 and 86% in the levels of NRSF mRNA. Data are mean ± S.D. (n = 3). *, p < 0.05.
FIGURE 2.
FIGURE 2.
NRSF recruits co-repressor protein factors to repress CART transcription. A–C, HeLa cells were transfected with the siRNAs against CoREST, HDAC1, HDAC2, mSin3A, or mSin3B. Seventy-two hours post-transfection, the RNA was extracted and the quantitative real-time PCR analysis was performed to measure the mRNA levels of each target molecule (A), CART (B), and NRSF (C). Data are mean ± S.D. (n = 3). *, p < 0.05. NC means the nontargeting control siRNA.
FIGURE 3.
FIGURE 3.
Overexpression of NRSF and co-repressor factors repress CART transcription. A–C, HeLa cells were transfected with the indicated plasmids. Forty-eight hours later, the total RNA was extracted and the mRNA levels of CART (A), the indicated factors (B) and NRSF (C) were measured by qPCR. Data are mean ± S.D. (n = 3). *, p < 0.05. NC means the empty control vector. D, NRSF-depleted HeLa cells were prepared with the lentivirus-mediated RNAi as described under “Experimental Procedures.” These cells were transfected with the indicated plasmid or control empty vector. Forty-eight hours later, the CART mRNA levels were measured by qPCR. Data are mean ± S.D. (n = 3). *, p < 0.05.
FIGURE 4.
FIGURE 4.
Both pNRSE and iNRSE are required for efficient repression of CART expression. A, schematic diagram of the luciferase reporter plasmids that include the promoter and/or intron 1 of human CART gene. B and C, the indicated reporter plasmids along with the pRL-CMV vector were transfected into SK-N-SH (B) or HeLa (C) cells, which express relative lower or higher levels of endogenous NRSF, respectively. The relative luciferase activities are normalized by the activity of the pRL-CMV control. D, schematic diagram of reporter gene constructs that include pNRSE and/or iNRSE elements of the CART gene. Mutations were introduced into the NRSE elements. E and F, the indicated reporter plasmids together with pRL-CMV were transfected into SK-N-SH (E) or HeLa (F) cells and the luciferase activity was measured. Data in B and C, E and F are mean ± S.D. (n = 3).
FIGURE 5.
FIGURE 5.
The NRSF-recruited co-repressor protein factors are involved in pNRSE and iNRSE-driven CART repression. A and B, the P-Luc-tI (A) and tP-Luc-I (B) luciferase reporter plasmids described in Fig. 4A (e and d, respectively) were transfected into HeLa cells together with the pRL-CMV control luciferase plasmid, the indicated siRNA against NRSF, CoREST, HDAC1, HDAC2, mSin3A, mSin3B, or the control siRNA (NC). Seventy-two hours post-transfection, the P-Luc-tI and tP-Luc-I luciferase activities were measured and normalized. Data are mean ± S.D. (n = 3). *, p < 0.05. C and D, the P-Luc-tI (A) and tP-Luc-I (B) luciferase reporter plasmids were transfected into HeLa cells together with the pRL-CMV control luciferase plasmid, the indicated overexpression plasmids. NC means the empty vector. Forty-eight hours post-transfection, the P-Luc-tI and tP-Luc-I luciferase activities were measured and normalized. Data are mean ± S.D. (n = 3). *, p < 0.05.
FIGURE 6.
FIGURE 6.
Activation of the CART promoter by forskolin was repressed by NRSF. A, schematic diagram of the reporter construct P-Luc-I that includes the CRE, pNRSE, and iNRSE elements. B, forskolin stimulation promotes CART luciferase activity. The pcDNA3.1 empty vector together with P-Luc-I (shown in Fig. 4A) and pRL-CMV were co-transfected into SK-N-SH cells. Then cells were stimulated with or without forskolin at the indicated concentrations. Twenty-four hours later, the cell lysates were prepared for luciferase activity analysis. Results are expressed as mean ± S.D. (n = 3). *, p < 0.05 (compare with the un-stimulated group). C, the SK-N-SH cells transfected as described in B were stimulated with forskolin of low or high concentrations (5 μm, 40 μm) for various times as indicated. The luciferase activity was measured. Results are expressed as mean ± S.D. (n = 3). *, p < 0.05. Based on these analyses, we selected 5 μm and 24 h stimulation of forskolin for the subsequent experiments described in Figs. 8 and 9. D, the pcDNA3.1 or pcDNA3.1-NRSF together with P-Luc-I and pRL-CMV were co-transfected into SK-N-SH cells. Then cells were stimulated with or without forskolin (5 μm, 24 h), and cell lysates were prepared for luciferase activity analysis. Results are expressed as mean ± S.D. (n = 3). E, quantitative analysis for CART mRNA was performed by real-time PCR. Each experiment was performed at least three times in triplicate. Data are presented as mean ± S.D. F, Western blot analysis was performed to measure the protein levels of CART.
FIGURE 7.
FIGURE 7.
OGD-mimicked hypoxia-ischemia up-regulates NRSF to repress CART and induce cell death. A and B, SK-N-SH cells were exposed to OGD for 3 h and then reoxygenation at 37 °C for 24 h. The expression levels of NRSF (A) and CART mRNA (B) were monitored by qPCR. C, Western blot was used to detect the protein levels of NRSF and CART. D, cell death was assessed by Annexin-V and PI labeling and flow cytometric analysis. Quadrant 1 (upper left), late necrosis; quadrant 2 (upper right), early necrosis/late apoptosis; quadrant 3 (lower left), live cells; quadrant 4 (lower right), early apoptosis. Cells unstained for Annexin V-FITC and PI are defined as viable cells. E and F, NRSF-depleted SK-N-SH cells were exposed to OGD and then reoxygenation. CART mRNA levels (E) and cell viability (F) were measured. Data in A and B and D–F are mean ± S.D. (n = 3). Each independent experiment was carried out in triplicate.
FIGURE 8.
FIGURE 8.
Forskolin stimulation promotes neuronal survival through up-regulation of CART. A and B, forskolin (5 μm) was added prior to OGD and maintained during OGD and throughout reoxygenation. Forskolin administration for 24 h increased the survival rate of SK-N-SH cells after OGD. C and D, addition of CART antibody attenuated the protective effect of forskolin. Data in B and D are mean ± S.D. (n = 3). Each independent experiment was carried out in triplicate. Representative FACS data of three independent experiments are shown in A and C.
FIGURE 9.
FIGURE 9.
Ectopic expression of NRSF antagonizes, whereas depletion of NRSF synergizes, the survival-promoting effects of forskolin-CREB signaling upon OGD treatment. A, SK-N-SH cells were transfected with increasing amounts of pcDNA3.1-NRSF together with CART P-Luc-I reporter plasmid. Then cells were stimulated with or without 5 μm forskolin for 24 h, and cell lysates were prepared for luciferase activity analysis. B, quantitative analysis for CART mRNA was performed by real-time PCR. The value of SK-N-SH cells transfected with pcDNA3.1 control plasmids was arbitrarily set as 1.0. C-F, ectopic NRSF repressed (C and D), whereas siRNA against NRSF increased (E and F) forskolin-stimulated cell survival after OGD. SK-N-SH cells exposed to OGD for 3 h were transiently transfected with pcDNA3.1 or pcDNA3.1-NRSF (400 ng/well) (C and D) or siRNA against NRSF (E and F), stimulated by forskolin or not. Cell death was measured by flow cytometric analysis. Data in C and E are representative data of three independent experiments in D and F, respectively. Cells unstained for Annexin V-FITC and PI are defined as viable cells. Data are mean ± S.D. Each experiment was performed three times independently.

Similar articles

Cited by

References

    1. Kuhar M. J., Dall Vechia S. E. (1999) CART peptides. Novel addiction- and feeding-related neuropeptides. Trends Neurosci. 22, 316–320 - PubMed
    1. Kuriyama G., Takekoshi S., Tojo K., Nakai Y., Kuhar M. J., Osamura R. Y. (2004) Cocaine- and amphetamine-regulated transcript peptide in the rat anterior pituitary gland is localized in gonadotrophs and suppresses prolactin secretion. Endocrinology 145, 2542–2550 - PubMed
    1. Vicentic A., Dominguez G., Hunter R. G., Philpot K., Wilson M., Kuhar M. J. (2004) Cocaine- and amphetamine-regulated transcript peptide levels in blood exhibit a diurnal rhythm. Regulation by glucocorticoids. Endocrinology 145, 4119–4124 - PubMed
    1. Upadhya M. A., Nakhate K. T., Kokare D. M., Singh U., Singru P. S., Subhedar N. K. (2012) CART peptide in the nucleus accumbens shell acts downstream to dopamine and mediates the reward and reinforcement actions of morphine. Neuropharmacology 62, 1823–1833 - PubMed
    1. Balkan B., Keser A., Gozen O., Koylu E. O., Dagci T., Kuhar M. J., Pogun S. (2012) Forced swim stress elicits region-specific changes in CART expression in the stress axis and stress regulatory brain areas. Brain Res. 1432, 56–65 - PubMed

Publication types

MeSH terms

Substances

LinkOut - more resources