. 2012 Dec 14;287(51):43137-55.
doi: 10.1074/jbc.M112.413047. Epub 2012 Oct 19.

Bromodomain-containing protein 4 (BRD4) regulates RNA polymerase II serine 2 phosphorylation in human CD4+ T cells

Affiliations

Bromodomain-containing protein 4 (BRD4) regulates RNA polymerase II serine 2 phosphorylation in human CD4+ T cells

Weishi Zhang et al. J Biol Chem. .

Abstract

Transcriptional elongation by RNA polymerase II (Pol II) is regulated by positive transcription elongation factor b (P-TEFb) in association with bromodomain-containing protein 4 (BRD4). We used genome-wide chromatin immunoprecipitation sequencing in primary human CD4+ T cells to reveal that BRD4 co-localizes with Ser-2-phosphorylated Pol II (Pol II Ser-2) at both enhancers and promoters of active genes. Disruption of bromodomain-histone acetylation interactions by JQ1, a small-molecule bromodomain inhibitor, resulted in decreased BRD4 binding, reduced Pol II Ser-2, and reduced expression of lineage-specific genes in primary human CD4+ T cells. A large number of JQ1-disrupted BRD4 binding regions exhibited diacetylated H4 (lysine 5 and -8) and H3K27 acetylation (H3K27ac), which correlated with the presence of histone acetyltransferases and deacetylases. Genes associated with BRD4/H3K27ac co-occupancy exhibited significantly higher activity than those associated with H3K27ac or BRD4 binding alone. Comparison of BRD4 binding in T cells and in human embryonic stem cells revealed that enhancer BRD4 binding sites were predominantly lineage-specific. Our findings suggest that BRD4-driven Pol II phosphorylation at serine 2 plays an important role in regulating lineage-specific gene transcription in human CD4+ T cells.


Figures

FIGURE 1.
FIGURE 1.
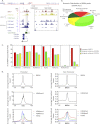
BRD4 binding is associated with active genes across the genome. UCSC genome browser views of BRD4 ChIP-seq peaks identified at active genes CD4 (top) and LCK (bottom) with 87.2 and 8.9 RPKM respective expression levels as assessed by RNA-seq (A); silent genes IL13 (top) and IL5 (bottom) with 0 RPKM expression as assessed by RNA-seq (B). C, Refseq transcripts were categorized according to RNA-seq RPKM expression levels (x axis), and the relative proportion of transcripts in each category (y axis) with BRD4 targets were identified by the maroon color. D, average BRD4 peak height was calculated for bins of 100 transcripts each and then analyzed by Spearman correlation. Average BRD4 peak height is shown against RPKM expression per 100 genes (transcripts are sorted by expression values). Spearman correlation was r = 0.848 (see also supplemental Fig. S1).
FIGURE 2.
FIGURE 2.
BRD4 binding occurs at both promoters and enhancers. A, UCSC genome browser view of chromatin modification patterns (data obtained from Refs. and 19) as well as BRD4 distribution and CpG islands at the CXCR4 gene locus. Binding and histone modifications observed at the promoter (left black box) and enhancer region 7–24 kb upstream (right black box) are shown. B, locations of BRD4 peaks relative to gene annotations. C, the percentage of BRD4 peaks associated with different histone modifications and CpG islands was calculated for promoter, intergenic, and intragenic regions by assessing overlap of the histone mark with the 1 kb region flanking the BRD4 peak max. D, average normalized tag counts for BRD4 (top panel), H3K4me3 (middle panel), and H3K4me1, me2, H2AZ, and H3K27me3 (bottom panel) in 10-kb windows centered on the TSS of all BRD4-associated refseq transcripts (left, promoter) and 10-kb windows centered on the BRD4 peak max position at all enhancer BRD4 binding sites (right, non promoter) (see also supplemental Fig. S2).
FIGURE 3.
FIGURE 3.
BRD4 and Pol II co-localize at promoters and enhancers. UCSC genome browser view of chromatin modification patterns, different phosphorylated Pol II (PolII) states, BRD4 and CpG islands at the CXCR4 gene locus (A), and the FOS gene locus (B). C, heat map illustrating normalized tag counts for BRD4, different phosphorylated states of Pol II, histone marks, and CpG islands in 10-kb windows centered on the TSS of 29,658 Refseq transcripts. Windows in each panel were ordered by decreasing Pol II 4H8 tag levels. CpG islands were given artificial tag counts. Image contrast was set to three for all heat maps except for CpG (0.81), H3K27me3 (0.3), and H3K36me3 (1.01). D, heat map representation in 10-kb windows centered on the BRD4 peak max positions of 21,053 enhancer BRD4 binding sites. Windows in each panel were ordered by decreasing Pol II 4H8 tag levels. Image contrast settings for all heat maps were the same as in D (see also supplemental Fig. S3). Unphos, unphosphorylated.
FIGURE 4.
FIGURE 4.
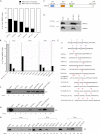
Global association of BRD4 with H4 diacetylation at K5 and K8. A, proportion of total BRD4 binding sites that exhibited specific acetylations within 1 kb of the BRD4 peak max position (left to right; H4K5ac, H4K8ac, H3K9ac, H4K16ac, H4K12ac, and H3K14ac). B, the proportion of BRD4 binding sites associated with different combinatorial patterns of histone acetylations. Percentage of sites with none of the predominant H4 acetylations (striped bar) and sites that exhibited H4K5 and H4K8 monoacetylation or combinations of H4K5 and H4K8 acetylation (black bars). C, representation of BRD4 indicating BD1, BD2, ET, and CTM domains. D, Western blot identifying H4K5ac and H4K8ac in mononucleosomes from Jurkat T cells incubated with purified GST, GST-BD1-BRD4, and GST-BD2-BRD4 proteins to demonstrate preferential mononucleosome association with BD1. E, positions of lysines that can be acetylated in H3 (first peptide sequence) and H4 (second peptide sequence), and acetylated/trimethylated H4 and H3 synthetic peptides as used for the BD1-peptide binding assays. F–H, peptide binding was performed by incubating GST-purified BD1-BRD4 proteins with N terminus-biotinylated synthetic H4 peptides (F), various combinations of H3 acetylations (G), and H3K4 trimethylation (H), and H4 peptides carrying acetylation modifications at specific lysine residues corresponding to B. Control peptides used were histones with no modifications. BDI, bromodomain I; BDII, bromodomain II; ET, extraterminal; CTM, C-terminal motif.
FIGURE 5.
FIGURE 5.
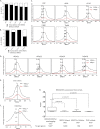
Two distinct classes of BRD4 binding confer different levels of gene transcription. Percentage of total HATs (A; p300, CBP, Tip60, p300/CBP-associated factor, males-absent-on-the-first) and HDACs (B; HDAC1, HDAC2, HDAC3, and HDAC6) that displayed BRD4 binding within 1 kb of the enzyme peak max position. C–F, average normalized tag count distribution in 2-kb windows centered on untreated BRD4 binding peak max positions for two classes of BRD4 binding sites: H4ac+ sites (one or more H4 acetylations; black) and H4ac sites (no H4 acetylations; red) for HATs (C), HDACs (D), Pol II Ser-2 (E), and H3K27ac (F). G, box plots showing the 10–90th percentile of the RNA-seq RPKM expression range for genes with BRD4 and H3K27ac overlapping sites, BRD4 unique sites (genes displaying BRD4 binding but not H3K27ac), H3K27ac unique sites (genes displaying H3K27ac but not BRD4 binding) and DHS unique sites (genes displaying DHS but not H3K27ac or BRD4). Non-parametric analysis of variance (Kruskal-Wallis test) p value <2.2 × 10⁻¹⁶. Pairwise Wilcoxon rank-sum test p values (Bonferroni-adjusted) are indicated in the figure.
FIGURE 6.
FIGURE 6.
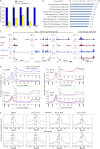
BRD4 regulates Pol II phosphorylation at Ser-2. A, RNA expression of CXCR4, RUNX3, CD4, IL2RA and FOS in untreated CD4+ T cells (blue bars) and JQ1-treated CD4+ T cells (yellow bars) expressed as a ratio of the mean gene expression in the untreated cells (error bars indicate S.D. of at least three independent sets of experimental data). B, top 10 enriched pathways identified by Ingenuity Pathway Analysis for JQ1-sensitive BRD4 target genes, ordered by decreasing negative log10 p values. C, UCSC genome browser view of normalized BRD4 and Pol II Ser-2 binding at JQ1-sensitive genes MAL, IL2RA, and FOSL2 (left to right) compared with JQ1-resistant gene B2M both pre- (blue tracks) and post- (red tracks) JQ1 treatment. D, average normalized tag count distribution in the 2 kb upstream region, 2kb downstream region, and in the gene body for all JQ1-sensitive BRD4-associated refseq transcripts. Distributions shown are BRD4 (top left), Pol II Ser-2 (bottom left), Pol II Ser-5 (top right), and total Pol II (4H8) (bottom right) both before (blue profile) and after JQ1 treatment (red profile). '0′ - TSS and '1′ - transcription termination site (TTS). E, average normalized tag count distribution in 2-kb windows centered on enhancer BRD4 peak max positions for BRD4 (left panel), Pol II Ser-2 (middle left panel), total Pol II (4H8) (middle left panel), and Pol II Ser-5 (right panel). Tag count distributions were plotted for intronic enhancers (top panel) and intergenic enhancers (bottom panel). Profile coloration is consistent with D.
FIGURE 7.
FIGURE 7.
Lineage-specific BRD4 binding in CD4+ T cells and hESCs. A, left: heat map illustrating normalized tag counts for BRD4 in T cells (white) and hESCs (purple) in 5-kb windows centered on BRD4 peak max (33,544 loci in T cells, 19,061 loci in hESC). Right: Venn diagram representation of global peak overlap between 5-kb windows centered on T cell peak max positions (teal) and hESC peaks (purple). B, left: heat map illustrating normalized tag counts for BRD4 in T cells (white) and hESCs (purple) in 5-kb windows centered on BRD4 peak max at promoters (12,491 loci in T cells, and 4,706 loci in hESC). Right: Venn diagram representation of peak overlap between 5-kb windows centered on T cell promoter peak max positions (teal) and hESC peaks (purple). C, left: heat map illustrating normalized tag counts for BRD4 in T cells (white) and hESCs (purple) in 5-kb windows centered on enhancer peak max (21,053 loci in T cells; 14,355 loci in hESCs). Right: Venn diagram representation of peak overlap between 5-kb windows centered on T cell enhancer peak max positions (teal) and hESC peaks (purple). D, selected ingenuity pathway analysis pathways and negative log10 p values for gene sets categorized according to the presence of T cell-specific sites (blue), hESC-specific sites (red), and T cell and hESC overlapping sites (green). Top, T cell-related pathways; middle, ESC-related pathways; and bottom, general cell function pathways. G–I, Venn diagram representation of CD4+ T cells showing target gene overlap between DHS-associated genes (red) and BRD4-associated genes (teal; G); promoter peak overlap between DHS (red) and BRD4 peaks (teal) at the promoter (H); enhancer peak overlap between DHS (red) and BRD4 peaks (teal) at enhancer regions (I). Value under library label indicates the total number of DHS/BRD4 sites used in each comparison. White text, number/percentage of overlapping genes/sites in each library. Black text on Venn diagram indicates number/percentage of non-overlapping genes/sites in each library.
FIGURE 8.
FIGURE 8.
BRD4 regulates Pol II Ser-2 phosphorylation via P-TEFb. A, average normalized tag count distribution in 4-kb windows centered on the TSS (left panel) and enhancer BRD4 peak max (right panel) for BRD4, Pol II Ser-2, and H3K4me3. B, co-immunoprecipitation of BRD4 and CDK9 using antibodies against IgG, CDK9, and BRD4. Immunoprecipitated proteins were analyzed by Western blotting with anti-BRD4 (top panel) or anti-CDK9 (bottom panel). C–E, ChIP of CDK9 at regions where both BRD4 and Pol II Ser-2 binding were observed in Jurkat T cells; CXCR4 (C), FOS (D), and CXCR5 (E). Primer sites are shown on the figure.

Similar articles

Cited by

References

    1. Hochheimer A., Tjian R. (2003) Diversified transcription initiation complexes expand promoter selectivity and tissue-specific gene expression. Genes Dev. 17, 1309–1320 - PubMed
    1. Rahl P. B., Lin C. Y., Seila A. C., Flynn R. A., McCuine S., Burge C. B., Sharp P. A., Young R. A. (2010) c-Myc regulates transcriptional pause release. Cell 141, 432–445 - PMC - PubMed
    1. Guenther M. G., Levine S. S., Boyer L. A., Jaenisch R., Young R. A. (2007) A chromatin landmark and transcription initiation at most promoters in human cells. Cell 130, 77–88 - PMC - PubMed
    1. Kim T. H., Barrera L. O., Zheng M., Qu C., Singer M. A., Richmond T. A., Wu Y., Green R. D., Ren B. (2005) A high-resolution map of active promoters in the human genome. Nature 436, 876–880 - PMC - PubMed
    1. Hirose Y., Ohkuma Y. (2007) Phosphorylation of the C-terminal domain of RNA polymerase II plays central roles in the integrated events of eucaryotic gene expression. J. Biochem. 141, 601–608 - PubMed

Publication types

MeSH terms

Associated data