Sertoli cell-specific expression of metastasis-associated protein 2 (MTA2) is required for transcriptional regulation of the follicle-stimulating hormone receptor (FSHR) gene during spermatogenesis
- PMID: 23086931
- PMCID: PMC3504762
- DOI: 10.1074/jbc.M112.383802
Sertoli cell-specific expression of metastasis-associated protein 2 (MTA2) is required for transcriptional regulation of the follicle-stimulating hormone receptor (FSHR) gene during spermatogenesis
Abstract
Background: Desensitization of FSH response by down-regulation of FSHR transcription is critical for FSH action.
Results: Chromatin modifier MTA2 participates in the down-regulation of FSHR transcription.
Conclusion: The FSH/Ar/MTA2 cascade may serve as an indispensable negative feedback mechanism to modulate FSH transduction events in Sertoli cells.
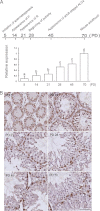
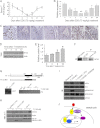
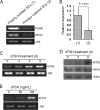
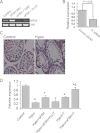
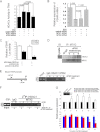
Significance: Our findings provide new insights into mechanisms by which FSH is deregulated in male infertile patients. The effect of follicle-stimulating hormone (FSH) on spermatogenesis is modulated at a fundamental level by controlling the number of competent receptors present at the surface of Sertoli cells (SCs). One underlying mechanism is the down-regulation of the expression levels of the FSH receptor (FSHR) gene after exposure to FSH. Here we report that metastasis-associated protein 2 (MTA2), a component of histone deacetylase and nucleosome-remodeling complexes, as a gene product induced directly by testosterone or indirectly by FSH, is exclusively expressed in SCs. Stimulation of SCs with FSH is accompanied by up-regulation of MTA2 expression and enhancement of deacetylase activity. This effect requires the integrity of functional androgen receptor. Furthermore, MTA2 is a potent corepressor of FSHR transcription, because it can recruit histone deacetylase-1 onto the FSHR promoter and participates in the down-regulation of FSHR expression upon FSH treatment. Abolishment of endogenous MTA2 by siRNA treatment disrupted the desensitization of the FSH response and thereafter impaired the FSH-dependent secretory function of SCs. From a clinical standpoint, deregulated expression of MTA2 in SCs of human pathological testes negatively correlates to the deregulated level of serum FSH. Overall, our present results provide the first evidence that the FSH/androgen receptor/MTA2 cascade may serve as an indispensable negative feedback mechanism to modulate the transduction events of SCs in response to FSH. These data also underscore an unexpected reproductive facet of MTA2, which may operate as a novel integrator linking synergistic actions of FSH and androgen signaling in SCs.
Figures



Similar articles
-
Elicitation of metastasis associated protein 2 expression in the phagocytosis by murine testicular Sertoli cells.Biochem Biophys Res Commun. 2014 Mar 14;445(3):667-72. doi: 10.1016/j.bbrc.2014.02.082. Epub 2014 Feb 26. Biochem Biophys Res Commun. 2014. PMID: 24583130
-
Alteration of follicle-stimulating hormone and testosterone regulation of messenger ribonucleic acid for Sertoli cell proteins in the rat during the acute phase of spinal cord injury.Biol Reprod. 2000 Sep;63(3):730-5. doi: 10.1095/biolreprod63.3.730. Biol Reprod. 2000. PMID: 10952914
-
Mechanisms involved in the homologous down-regulation of transcription of the follicle-stimulating hormone receptor gene in Sertoli cells.Mol Cell Endocrinol. 2001 Feb 28;173(1-2):95-107. doi: 10.1016/s0303-7207(00)00412-3. Mol Cell Endocrinol. 2001. PMID: 11223181
-
The expression of the follicle-stimulating hormone receptor in spermatogenesis.Recent Prog Horm Res. 2002;57:129-48. doi: 10.1210/rp.57.1.129. Recent Prog Horm Res. 2002. PMID: 12017540 Free PMC article. Review.
-
[FSH and FSHR gene polymorphisms and male infertility: An update].Zhonghua Nan Ke Xue. 2015 Nov;21(11):1031-4. Zhonghua Nan Ke Xue. 2015. PMID: 26738333 Review. Chinese.
Cited by
-
Role of hsa‑miR‑105 during the pathogenesis of paclitaxel resistance and its clinical implication in ovarian cancer.Oncol Rep. 2021 May;45(5):84. doi: 10.3892/or.2021.8035. Epub 2021 Apr 13. Oncol Rep. 2021. PMID: 33846814 Free PMC article.
-
Candidate genes associated with reproductive traits in rabbits.Trop Anim Health Prod. 2024 Mar 5;56(2):94. doi: 10.1007/s11250-024-03938-8. Trop Anim Health Prod. 2024. PMID: 38441694 Free PMC article. Review.
-
Upregulation and nuclear translocation of testicular ghrelin protects differentiating spermatogonia from ionizing radiation injury.Cell Death Dis. 2014 May 22;5(5):e1248. doi: 10.1038/cddis.2014.223. Cell Death Dis. 2014. PMID: 24853426 Free PMC article.
-
STUB1 directs FOXQ1-mediated transactivation of Ldha gene and facilitates lactate production in mouse Sertoli cells.Cell Tissue Res. 2023 May;392(2):565-579. doi: 10.1007/s00441-022-03705-x. Epub 2022 Dec 28. Cell Tissue Res. 2023. PMID: 36575252
-
Up-To-Date Review About Minipuberty and Overview on Hypothalamic-Pituitary-Gonadal Axis Activation in Fetal and Neonatal Life.Front Endocrinol (Lausanne). 2018 Jul 23;9:410. doi: 10.3389/fendo.2018.00410. eCollection 2018. Front Endocrinol (Lausanne). 2018. PMID: 30093882 Free PMC article. Review.
References
-
- Grinspon R. P., Rey R. A. (2010) Anti-Müllerian hormone and Sertoli cell function in paediatric male hypogonadism. Horm. Res. Paediatr. 73, 81–92 - PubMed
-
- Petersen C., Soder O. (2006) The sertoli cell. A hormonal target and “super” nurse for germ cells that determines testicular size. Horm. Res. 66, 153–161 - PubMed
-
- Loss E. S., Jacobus A. P., Wassermann G. F. (2007) Diverse FSH and testosterone signaling pathways in the Sertoli cell. Horm. Metab. Res. 39, 806–812 - PubMed
-
- Walker W. H., Cheng J. (2005) FSH and testosterone signaling in Sertoli cells. Reproduction 130, 15–28 - PubMed
-
- Toh Y., Nicolson G. L. (2009) The role of the MTA family and their encoded proteins in human cancers. Molecular functions and clinical implications. Clin. Exp. Metastasis 26, 215–227 - PubMed
Publication types
MeSH terms
Substances
LinkOut - more resources
Full Text Sources
Research Materials

