

H2O2-induced endothelial NO production contributes to vascular cell apoptosis and increased permeability in rat venules
- PMID: 23086988
- PMCID: PMC3543683
- DOI: 10.1152/ajpheart.00300.2012
H2O2-induced endothelial NO production contributes to vascular cell apoptosis and increased permeability in rat venules
Abstract
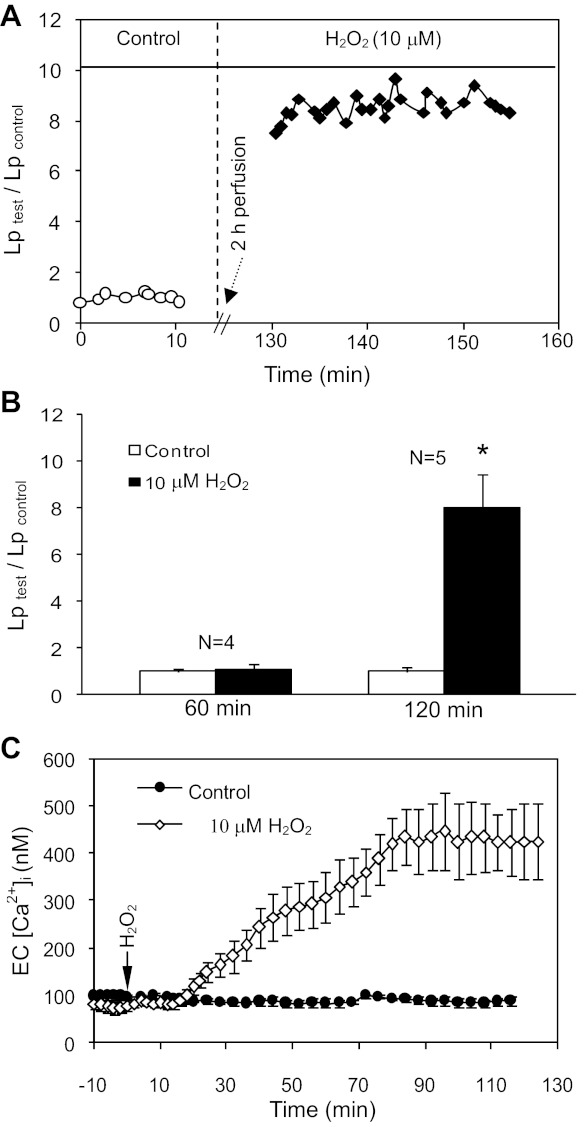
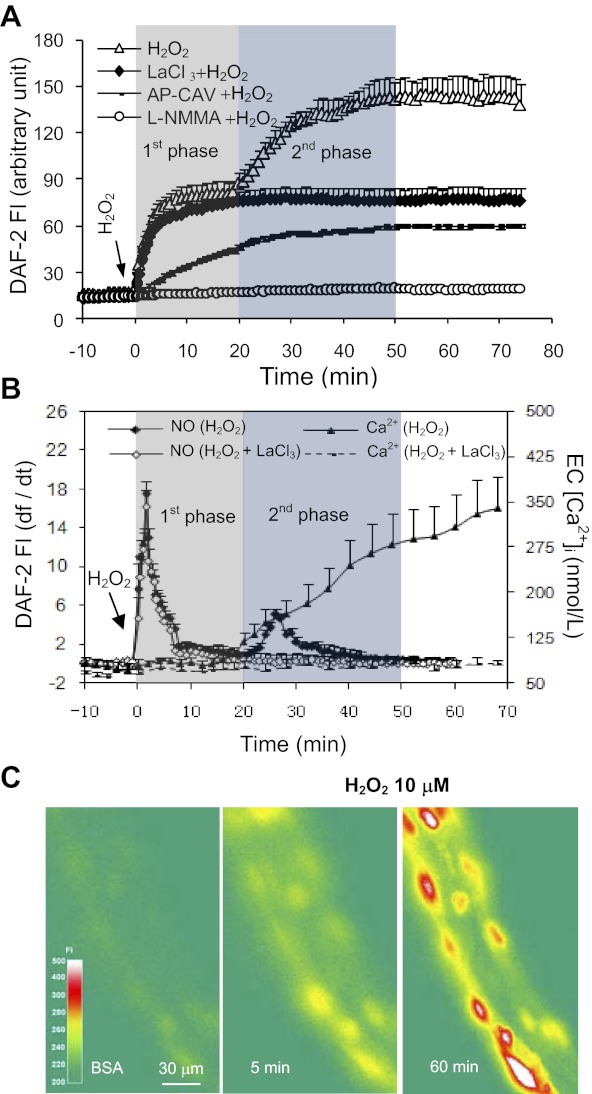
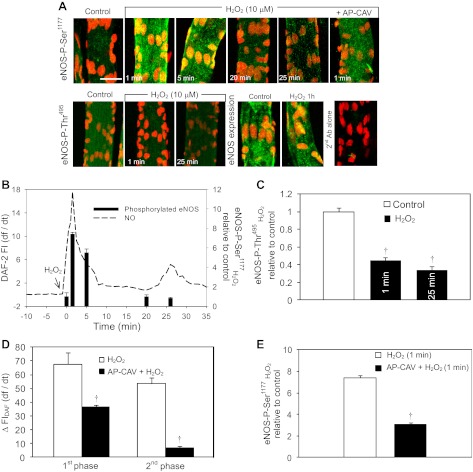
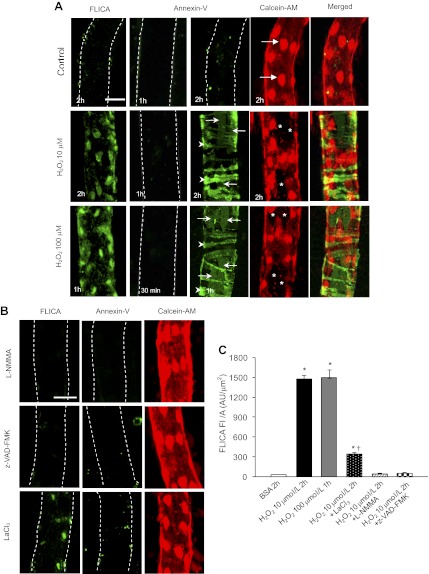
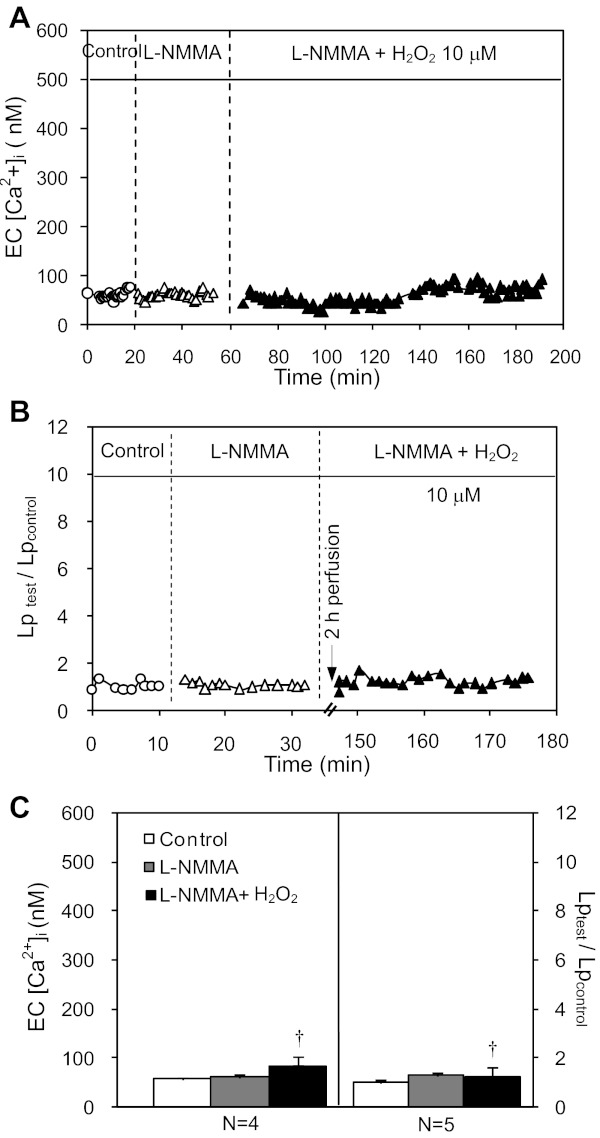
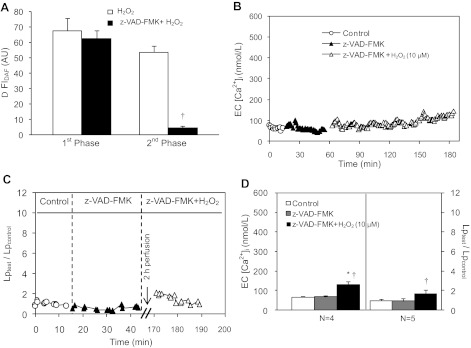
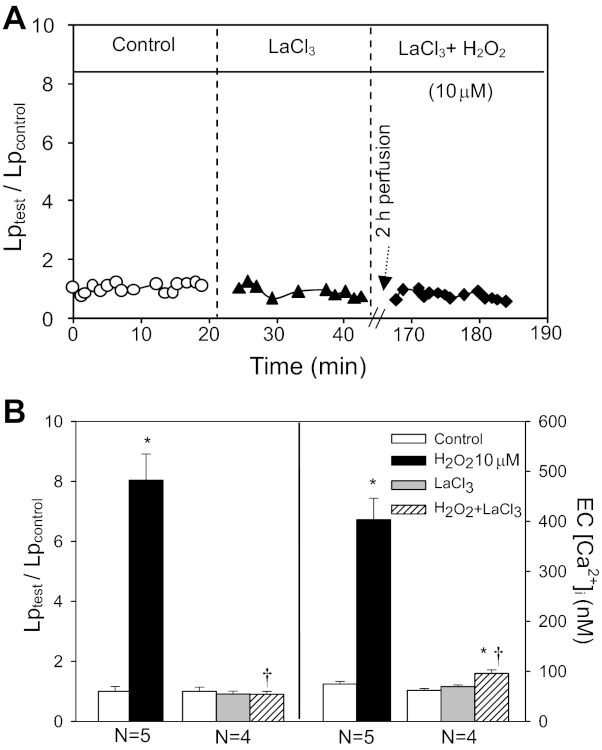
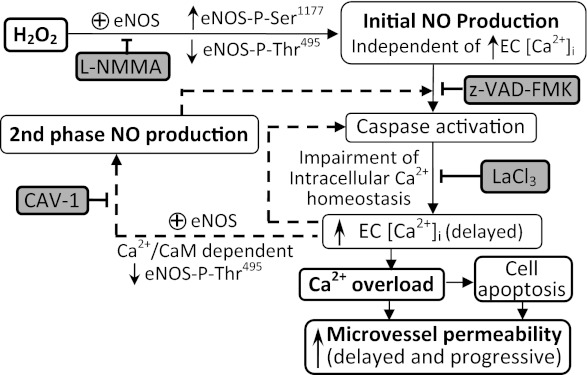
Although elevated levels of H(2)O(2) have been implicated to play important roles in the pathogenesis of various cardiovascular diseases, the underlying mechanisms remain unclear. This study aims to examine the effect of H(2)O(2) on endothelial nitric oxide (NO) production in intact venules, and elucidate the role and mechanisms of NO in H(2)O(2)-induced increases in microvessel permeability. Experiments were conducted on individually perfused rat mesenteric venules. Microvessel permeability was determined by measuring hydraulic conductivity (Lp), and endothelial [Ca(2+)](i) was measured on fura-2-loaded vessels. Perfusion of H(2)O(2) (10 μM) caused a delayed and progressively increased endothelial [Ca(2+)](i) and Lp, a pattern different from inflammatory mediator-induced immediate and transient response. Under the same experimental conditions, measuring endothelial NO via DAF-2 and the spatial detection of cell apoptosis by fluorescent markers revealed that H(2)O(2) induced two phases of NO production followed by caspase activation, intracellular Ca(2+) accumulation, and vascular cell apoptosis. The initial NO production was correlated with increased endothelial NO synthase (eNOS) Ser(1177) phosphorylation in the absence of elevated endothelial [Ca(2+)](i), whereas the second phase of NO depended on increased [Ca(2+)](i) and was associated with Thr(495) dephosphorylation without increased Ser(1177) phosphorylation. Inhibition of NOS prevented H(2)O(2)-induced caspase activation, cell apoptosis, and increases in endothelial [Ca(2+)](i) and Lp. Our results indicate that H(2)O(2) at micromolar concentration is able to induce a large magnitude of NO in intact venules, causing caspase activation-mediated endothelial Ca(2+) accumulation, cell apoptosis, and increases in permeability. The mechanisms revealed from intact microvessels may contribute to the pathogenesis of oxidant-related cardiovascular diseases.
Figures
Similar articles
-
H2 O2 -induced microvessel barrier dysfunction: the interplay between reactive oxygen species, nitric oxide, and peroxynitrite.Physiol Rep. 2019 Aug;7(16):10.14814/phy2.14206. doi: 10.14814/phy2.14206. Physiol Rep. 2019. PMID: 31448579 Free PMC article.
-
Caveolin-1 scaffolding domain promotes leukocyte adhesion by reduced basal endothelial nitric oxide-mediated ICAM-1 phosphorylation in rat mesenteric venules.Am J Physiol Heart Circ Physiol. 2013 Nov 15;305(10):H1484-93. doi: 10.1152/ajpheart.00382.2013. Epub 2013 Sep 16. Am J Physiol Heart Circ Physiol. 2013. PMID: 24043249 Free PMC article.
-
Endothelial [Ca2+]i and caveolin-1 antagonistically regulate eNOS activity and microvessel permeability in rat venules.Cardiovasc Res. 2010 Jul 15;87(2):340-7. doi: 10.1093/cvr/cvq006. Epub 2010 Jan 15. Cardiovasc Res. 2010. PMID: 20080986 Free PMC article.
-
Temporal and spatial correlation of platelet-activating factor-induced increases in endothelial [Ca²⁺]i, nitric oxide, and gap formation in intact venules.Am J Physiol Heart Circ Physiol. 2011 Nov;301(5):H1788-97. doi: 10.1152/ajpheart.00599.2011. Epub 2011 Aug 26. Am J Physiol Heart Circ Physiol. 2011. PMID: 21873500 Free PMC article.
-
Hydrogen peroxide as an endogenous mediator and exogenous tool in cardiovascular research: issues and considerations.Curr Opin Pharmacol. 2008 Apr;8(2):153-9. doi: 10.1016/j.coph.2007.12.012. Epub 2008 Feb 19. Curr Opin Pharmacol. 2008. PMID: 18243791 Review.
Cited by
-
Dietary Supplementation with Enterococcus faecium R1 Attenuates Intestinal and Liver Injury in Piglets Challenged by Lipopolysaccharide.Animals (Basel). 2021 May 16;11(5):1424. doi: 10.3390/ani11051424. Animals (Basel). 2021. PMID: 34065711 Free PMC article.
-
Leveraging avidin-biotin interaction to quantify permeability property of microvessels-on-a-chip networks.Am J Physiol Heart Circ Physiol. 2022 Jan 1;322(1):H71-H86. doi: 10.1152/ajpheart.00478.2021. Epub 2021 Nov 12. Am J Physiol Heart Circ Physiol. 2022. PMID: 34767485 Free PMC article.
-
H2 O2 -induced microvessel barrier dysfunction: the interplay between reactive oxygen species, nitric oxide, and peroxynitrite.Physiol Rep. 2019 Aug;7(16):10.14814/phy2.14206. doi: 10.14814/phy2.14206. Physiol Rep. 2019. PMID: 31448579 Free PMC article.
-
Reduced flow-and acetylcholine-induced dilations in visceral compared to subcutaneous adipose arterioles in human morbid obesity.Microcirculation. 2015 Jan;22(1):44-53. doi: 10.1111/micc.12164. Microcirculation. 2015. PMID: 25155427 Free PMC article. Clinical Trial.
-
A1 adenosine receptor negatively modulates coronary reactive hyperemia via counteracting A2A-mediated H2O2 production and KATP opening in isolated mouse hearts.Am J Physiol Heart Circ Physiol. 2013 Dec 1;305(11):H1668-79. doi: 10.1152/ajpheart.00495.2013. Epub 2013 Sep 16. Am J Physiol Heart Circ Physiol. 2013. PMID: 24043252 Free PMC article.
References
-
- Banerjee D, Madhusoodanan UK, Nayak S, Jacob J. Urinary hydrogen peroxide: a probable marker of oxidative stress in malignancy. Clin Chim Acta 334: 205–209, 2003 - PubMed
-
- Cai H, Harrison DG. Endothelial dysfunction in cardiovascular diseases: the role of oxidant stress. Circ Res 87: 840–844, 2000 - PubMed
-
- Cai H, Li Z, Davis ME, Kanner W, Harrison DG, Dudley SC., Jr Akt-dependent phosphorylation of serine 1179 and mitogen-activated protein kinase kinase/extracellular signal-regulated kinase 1/2 cooperatively mediate activation of the endothelial nitric-oxide synthase by hydrogen peroxide. Mol Pharmacol 63: 325–331, 2003 - PubMed
Publication types
MeSH terms
Substances
Grants and funding
LinkOut - more resources
Full Text Sources
Other Literature Sources
Miscellaneous