. 2013 Jan 15;22(2):271-83.
doi: 10.1093/hmg/dds427. Epub 2012 Oct 18.

Changes in Purkinje cell firing and gene expression precede behavioral pathology in a mouse model of SCA2

Affiliations

Changes in Purkinje cell firing and gene expression precede behavioral pathology in a mouse model of SCA2

Stephen T Hansen et al. Hum Mol Genet. .

Abstract

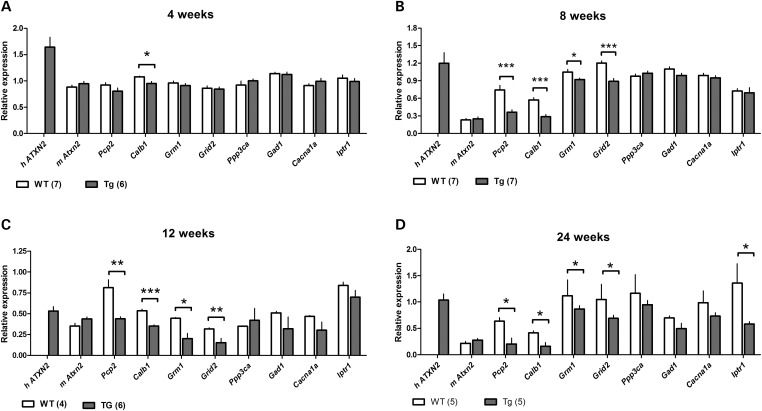
Spinocerebellar ataxia type 2 (SCA2) is an autosomal dominantly inherited disorder, which is caused by a pathological expansion of a polyglutamine (polyQ) tract in the coding region of the ATXN2 gene. Like other ataxias, SCA2 most overtly affects Purkinje cells (PCs) in the cerebellum. Using a transgenic mouse model expressing a full-length ATXN2(Q127)-complementary DNA under control of the Pcp2 promoter (a PC-specific promoter), we examined the time course of behavioral, morphologic, biochemical and physiological changes with particular attention to PC firing in the cerebellar slice. Although motor performance began to deteriorate at 8 weeks of age, reductions in PC number were not seen until after 12 weeks. Decreases in the PC firing frequency first showed at 6 weeks and paralleled deterioration of motor performance with progression of disease. Transcription changes in several PC-specific genes such as Calb1 and Pcp2 mirrored the time course of changes in PC physiology with calbindin-28 K changes showing the first small, but significant decreases at 4 weeks. These results emphasize that in this model of SCA2, physiological and behavioral phenotypes precede morphological changes by several weeks and provide a rationale for future studies examining the effects of restoration of firing frequency on motor function and prevention of future loss of PCs.


Figures

Figure 1.
Figure 1.
Progressive deterioration of motor performance on the accelerating rotarod beginning after 4 weeks of age. Latency to fall off the accelerating rotarod (left Y-axis) and RPMs (right Y-axis) data for ATXN2Q127 (gray circle) and WT animals (white circle). Data represent the mean ± SEM of three trials on the test day. Number of animals tested for WT and ATXN2Q127 animals are listed above and below, respectively. Two-way ANOVA comparing the age × genotype; Bonferroni post-hoc tests. *P < 0.5, **P < 0.01, ***P < 0.001. Error bars represent ±SEM.
Figure 2.
Figure 2.
Changes in PC number and molecular layer thickness occur late in ATXN2Q127 mice. Representative confocal images stained for calbindin 28-k from the ‘fissura prima’ of the cerebellar vermis: WT animals (A–E) and ATXN2Q127 transgenic mice (F–J) at 4, 8, 12 and 24 weeks of age are shown. (K) Graphical representation of changes in the molecular layer thickness. (L) PC count of ATXN2Q127 (gray bars) and WT (white bars) animals across age. N = 2–3 animals for each category. Two-way ANOVA comparing the age × genotype; Bonferroni post-hoc tests. *P < 0.05; **P < 0.01; ***P < 0.001. Error bars represent ±SEM. Scale bar = 200 μm
Figure 3.
Figure 3.
Ataxin-2 aggregates detected in mutant mice. As early as 4 weeks, occasional PCs show perinuclear aggregates. Note that at 24 weeks only aggregates remain visible. Representative immunohistochemical images from combined double staining for WT (A–D) and ATXN2Q127 (E–H) mice. Antibodies directed against calbindin 28-k (red) and ataxin-2 (green) detected the presence of aggregate formations (white arrows) in ATXN2Q127 animals across all age points. All images for a respective antibody were taken at the same exposure times. Scale bar = 100 μm
Figure 4.
Figure 4.
Early expression changes of key cerebellar genes including several PC-specific genes at four time points. Significant reductions in four genes are seen at 8 weeks, but not 4 weeks except for a minor reduction in calbindin mRNA levels. Quantitative PCR data from mouse cerebella comparing PC-specific gene expression of ATXN2Q127 (gray bars) and WT animals (white bars) (A–D). Genes tested: human transgene (h ATXN2), mouse ataxin-2 (mAtxn2), PC protein 2 (Pcp2), calbindin 28-k (Calb1), metabotropic glutamate receptor 1 (Grm1), glutamate receptor ionotropic delta-2 (Grid2), calcineurin (Ppp3ca), glutamate decarboxylase (Gad1), voltage-gated calcium channel Cav2.1 (Cacna1a), inositol triphosphate receptor 1 (Itpr1). N, size for each genotype and age group is listed in brackets. Gene expression normalized to the Wasf1 housekeeping gene. Student's two-tailed t-test compared ATXN2Q127 with WT gene expression in each age group. *P < 0.05, **P < 0.01, ***P < 0.001. Error bars represent ±SEM.
Figure 5.
Figure 5.
PC firing rate remains constant in WT but progressively decreases with age in ATXN2Q127 mice. To the left of each panel are examples of extracellular recordings from PCs at the indicated ages in WT and transgenic ATXN2Q127 mice. These one second traces show that firing decreases progressively with age in the transgenic (ATXN2Q127) but not WT mice. To the right of each panel are histograms of inter spike intervals for the 2 min recording periods from the same neuron. Indicated on each histogram are the mean firing rate and the local coefficient of variation (CV). All recordings were made at 34.5 ± 1°C and the experimenter was blinded to the genotype.
Figure 6.
Figure 6.
Population distributions of the mean PC firing rate show a shift towards slower firing with age in SCA2Q127 mice. Each histogram displays the distribution of mean firing rates of WT (black traces) and ATXN2Q127 PCs (gray filled traces) with the y-axis indicating the percent of total PCs recorded. The numbers of recorded PCs are 4 weeks: 120 WT, 79 ATXN2Q127; 6 weeks: 73 WT, 75 ATXN2Q127; 8 weeks: 48 WT, 54 ATXN2Q127; 12 weeks: 84 WT, 100 ATXN2Q127; 24 weeks: 59 WT, 85 ATXN2Q127; 40 weeks: 98 WT, 82 ATXN2Q127.
Figure 7.
Figure 7.
Mean firing rate in PCs decreases but firing variability and fraction of regularly firing cells are unchanged in ATXN2Q127 mice. (A) The mean frequency values in Hertz, shown in black line white circle for WT at 4, 6, 8, 12, 24 and 40 weeks, are 30 ± 1 (n = 120), 42 ± 1 (n = 73), 46 ± 3 (n = 48), 43 ± 2 (n = 84), 43 ± 2 (n = 59) and 48 ± 3 (n = 98), respectively. Significantly reduced PC firing frequency is already evident in ATXN2Q127 mice as early as 8 weeks of age and subsequently worsens. The mean values in Hertz for ATXN2Q127 PCs shown in gray are 34 ± 0.9 (n = 79), 35 ± 1 (n = 75), 32 ± 3 (54), 27 ± 1 (n = 100), 17 ± 1 (n = 85) and 11 ± 1 (n = 82) at 4, 6, 8, 12, 24 and 40 weeks, respectively. (B) The fraction of cells that show bursting behavior is low and does not differ significantly between the WT and ATXN2Q127 groups. (C) The coefficient of variation of adjacent intervals, a measure of the regularity of firing, is not significantly changed between WT and ATXN2Q127 mice. The firing variability values for control mice at different age groups are 0.068 ± 0.0003, 0.114 ± 0.009, 0.098 ± 0.009, 0.085 ± 0.005, 0.146 ± 0.017 and 0.132 ± 0.01 at 4, 6, 8, 12, 24 and 40 weeks, respectively, versus 0.057 ± 0.005, 0.091 ± 0.023, 0.077 ± 0.008, 0.083 ± 0.006, 0.109 ± 0.016 and 0.1 ± 0.01 in SCA2 transgenic mice at the same age group, respectively. Data in (A) and (C) are expressed in mean ± SEM. Two-way ANOVA comparing age × genotype followed by Bonferroni post-hoc tests yielded P-values indicating significant differences between WT and ATXN2Q127 mice: *P= 0.015, **P= 0.00024 and ***P< 8 × 10⁻⁷.
Figure 8.
Figure 8.
RT-PCR for Rbfox1-mediated alternative splice variants. RT-PCR gel images of alternative splice sights in channel-forming genes. Two age points (4 weeks: left column; 24 weeks: right column) were tested. WT = wild type, Tg = Atxn2Q127. Voltage-dependent calcium channels: Cav2.2 (Cacna1B), Cav1.3 (Cacna1D), Cav1.1 (Cacna1s). Voltage-gated potassium channels: Kv4.3 (Kcnd3), Kv7.2 (Kcnq2). Voltage-gated sodium channel Nav1.6: exon 5 (Scn8a (5)), exon 18 (Scn8a (18)).

References

    1. Pulst S.M., Nechiporuk A., Nechiporuk T., Gispert S., Chen X. N., Lopes-Cendes I., Pearlman S., Starkman S., Orozco-Diaz G., Lunkes A., et al. Moderate expansion of a normally biallelic trinucleotide repeat in spinocerebellar ataxia type 2. Nat. Genet. 1996;14:269–276. doi:10.1038/ng1196-269. - DOI - PubMed
    1. Pulst S.M., Santos N., Wang D., Yang H., Huynh D., Velazquez L., Figueroa K.P. Spinocerebellar ataxia type 2: polyQ repeat variation in the CACNA1A calcium channel modifies age of onset. Brain. 2005;128:2297–2303. doi:10.1093/brain/awh586. - DOI - PubMed
    1. van de Warrenburg B.P., Hendriks H., Durr A., van Zuijlen M.C., Stevanin G., Camuzat A., Sinke R.J., Brice A., Kremer B.P. Age at onset variance analysis in spinocerebellar ataxias: a study in a Dutch–French cohort. Ann. Neurol. 2005;57:505–512. doi:10.1002/ana.20424. - DOI - PubMed
    1. Servadio A., Koshy B., Armstrong D., Antalffy B., Orr H.T., Zoghbi H.Y. Expression analysis of the ataxin-1 protein in tissues from normal and spinocerebellar ataxia type 1 individuals. Nat. Genet. 1995;10:94–98. doi:10.1038/ng0595-94. - DOI - PubMed
    1. Banfi S., Servadio A., Chung M., Capozzoli F., Duvick L.A., Elde R., Zoghbi H.Y., Orr H.T. Cloning and developmental expression analysis of the murine homolog of the spinocerebellar ataxia type 1 gene (Sca1) Hum. Mol. Genet. 1996;5:33–40. doi:10.1093/hmg/5.1.33. - DOI - PubMed

Publication types

MeSH terms