. 2012 Oct 11:6:149.
doi: 10.3389/fnins.2012.00149. eCollection 2012.

On the plurality of (methodological) worlds: estimating the analytic flexibility of FMRI experiments

Affiliations

On the plurality of (methodological) worlds: estimating the analytic flexibility of FMRI experiments

Joshua Carp. Front Neurosci. .

Abstract

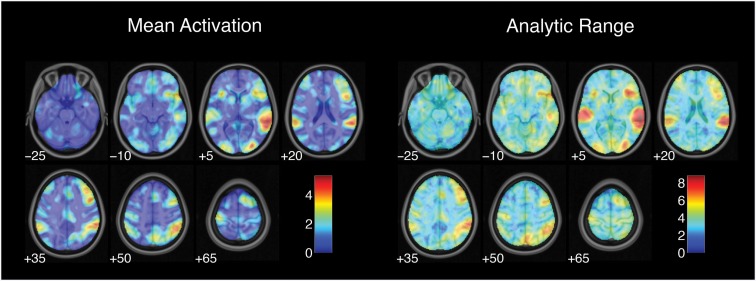
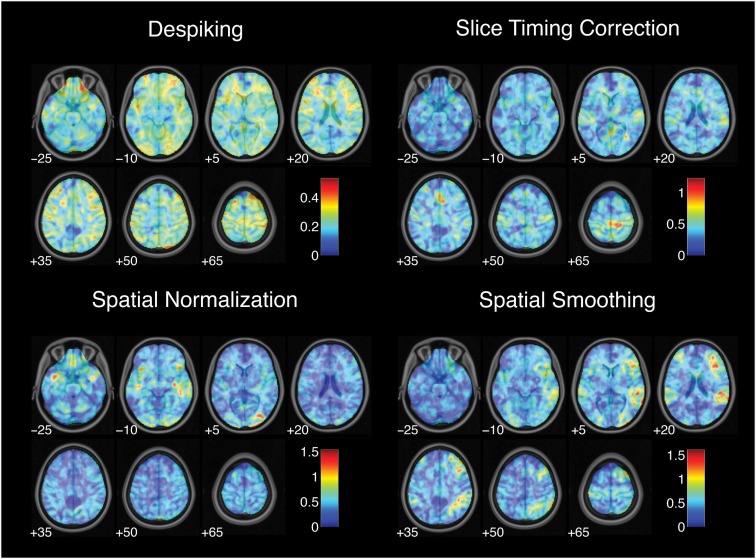
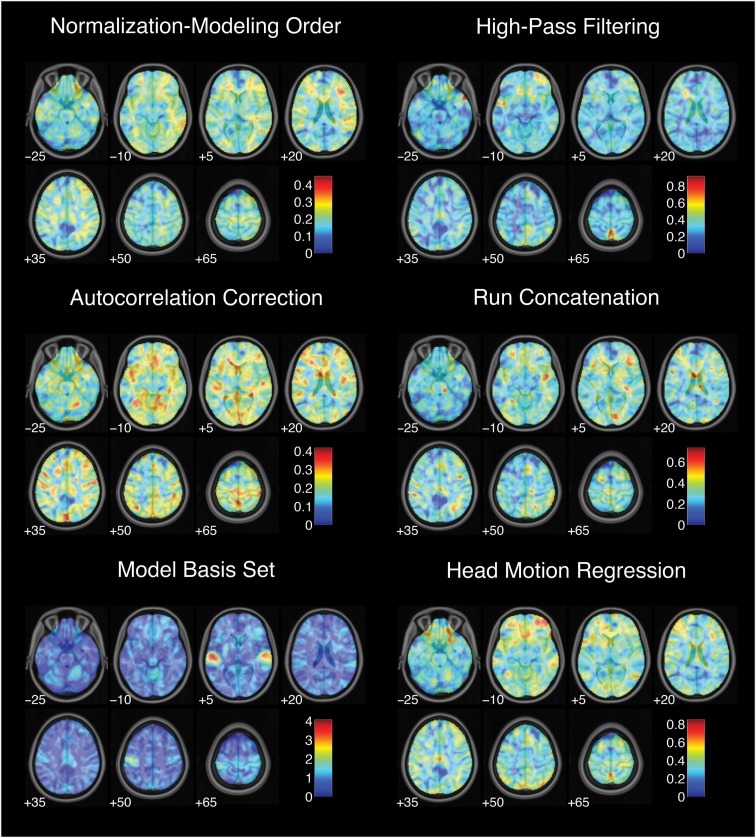
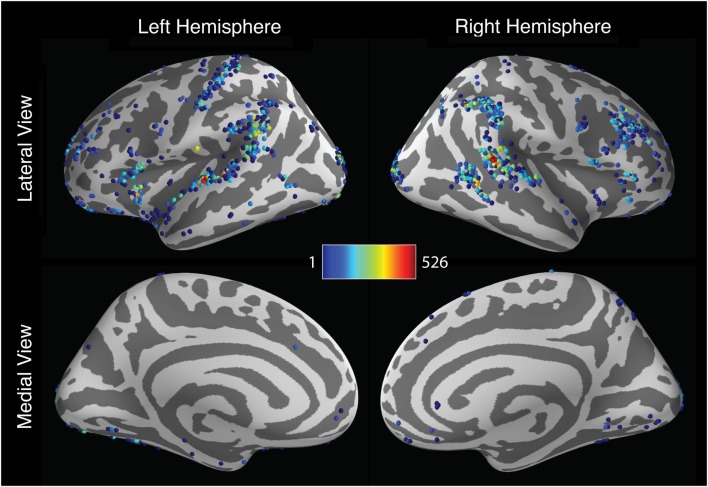
How likely are published findings in the functional neuroimaging literature to be false? According to a recent mathematical model, the potential for false positives increases with the flexibility of analysis methods. Functional MRI (fMRI) experiments can be analyzed using a large number of commonly used tools, with little consensus on how, when, or whether to apply each one. This situation may lead to substantial variability in analysis outcomes. Thus, the present study sought to estimate the flexibility of neuroimaging analysis by submitting a single event-related fMRI experiment to a large number of unique analysis procedures. Ten analysis steps for which multiple strategies appear in the literature were identified, and two to four strategies were enumerated for each step. Considering all possible combinations of these strategies yielded 6,912 unique analysis pipelines. Activation maps from each pipeline were corrected for multiple comparisons using five thresholding approaches, yielding 34,560 significance maps. While some outcomes were relatively consistent across pipelines, others showed substantial methods-related variability in activation strength, location, and extent. Some analysis decisions contributed to this variability more than others, and different decisions were associated with distinct patterns of variability across the brain. Qualitative outcomes also varied with analysis parameters: many contrasts yielded significant activation under some pipelines but not others. Altogether, these results reveal considerable flexibility in the analysis of fMRI experiments. This observation, when combined with mathematical simulations linking analytic flexibility with elevated false positive rates, suggests that false positive results may be more prevalent than expected in the literature. This risk of inflated false positive rates may be mitigated by constraining the flexibility of analytic choices or by abstaining from selective analysis reporting.

Keywords: analysis flexibility; data analysis; fMRI; false positive results; selective reporting.


Figures

Figure 1
Figure 1
Variation in activation strength across analysis pipelines. Mean activation denotes the average Z-value for each voxel across all analysis pipelines; analysis range denotes the range of Z-values across all pipelines. Images are presented in neurological orientation, with the left hemisphere displayed on the left. Note that color scales differ across panels.
Figure 2
Figure 2
Variation in activation strength attributable to pre-processing choices. Images are presented in neurological orientation, with the left hemisphere displayed on the left. Note that color scales differ across panels.
Figure 3
Figure 3
Variation in activation strength attributable to model estimation choices. Images are presented in neurological orientation, with the left hemisphere displayed on the left. Note that color scales differ across panels.
Figure 4
Figure 4
Spatial distribution of peak activation locations across analysis pipelines across the cerebral hemispheres. Shaded spheres indicate the locations of activation peaks. Sphere colors denote the base-10 logarithm of the number of pipelines yielding maximal activation for that location; colors range from blue, indicating a single pipeline, to red, indicating 526 pipelines.
Figure 5
Figure 5
Spatial distribution of peak activation locations across analysis within anatomically defined regions of interest (ROIs). Red contour lines indicate the boundaries of the ROIs. All images represent lateral views of the right hemisphere. Shaded spheres indicate the locations of activation peaks. Sphere colors denote the base-10 logarithm of the number of pipelines yielding maximal activation for that location. For the right inferior frontal gyrus ROI (left panel), colors range from blue, indicating a single pipeline, to red, indicating 639 pipelines. For the right temporal cortex ROI (right panel), colors range from blue, indicating a single pipeline, to red, indicating 844 pipelines.
Figure 6
Figure 6
Activation significance across analysis pipelines using three variants of a Monte Carlo thresholding procedure. Significance proportion denotes the fraction of thresholded maps yielding significant activation for each voxel. Discordance index denotes the level of disagreement across threshold maps. Images are presented in neurological orientation, with the left hemisphere displayed on the left. Note that color scales range from 0 to 1 for significance proportion and from 0 to 0.5 for discordance index.
Figure 7
Figure 7
Activation significance across analysis pipelines using false discovery rate and Gaussian random field theory error corrections. Significance proportion denotes the fraction of thresholded maps yielding significant activation for each voxel. Discordance index denotes the level of disagreement across threshold maps. Images are presented in neurological orientation, with the left hemisphere displayed on the left. Note that color scales range from 0 to 1 for significance proportion and from 0 to 0.5 for discordance index.

Similar articles

Cited by

References

    1. Aron A., Behrens T., Smith S., Frank M., Poldrack R. (2007). Triangulating a cognitive control network using diffusion-weighted magnetic resonance imaging (MRI) and functional MRI. J. Neurosci. 27, 3743–375210.1523/JNEUROSCI.0519-07.2007 - DOI - PMC - PubMed
    1. Aron A., Robbins T., Poldrack R. (2004). Inhibition and the right inferior frontal cortex. Trends Cogn. Sci. (Regul. Ed.) 8, 170–17710.1016/j.tics.2004.02.010 - DOI - PubMed
    1. Bossuyt P., Reitsma J., Bruns D., Gatsonis C., Glasziou P., Irwig L., et al. (2003). Towards complete and accurate reporting of studies of diagnostic accuracy: the STARD initiative. Br. Med. J. 326, 41–4410.1136/bmj.326.7379.41 - DOI - PMC - PubMed
    1. Carp J. (2011). Optimizing the order of operations for movement scrubbing: comment on Power et al. Neuroimage.10.1016/j.neuroimage.2011.12.061 - DOI - PubMed
    1. Carp J. (2012). The secret lives of experiments: methods reporting in the fMRI literature. Neuroimage 63, 289–30010.1016/j.neuroimage.2012.07.004 - DOI - PubMed

LinkOut - more resources