. 2012 Oct 18:6:74.
doi: 10.3389/fncir.2012.00074. eCollection 2012.

Temporal and spatial adaptation of transient responses to local features

Affiliations

Temporal and spatial adaptation of transient responses to local features

David C O'Carroll et al. Front Neural Circuits. .

Abstract

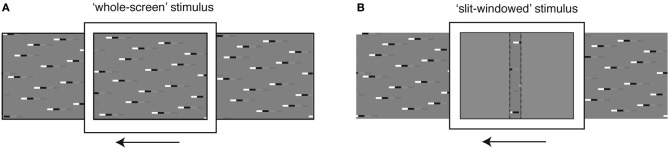
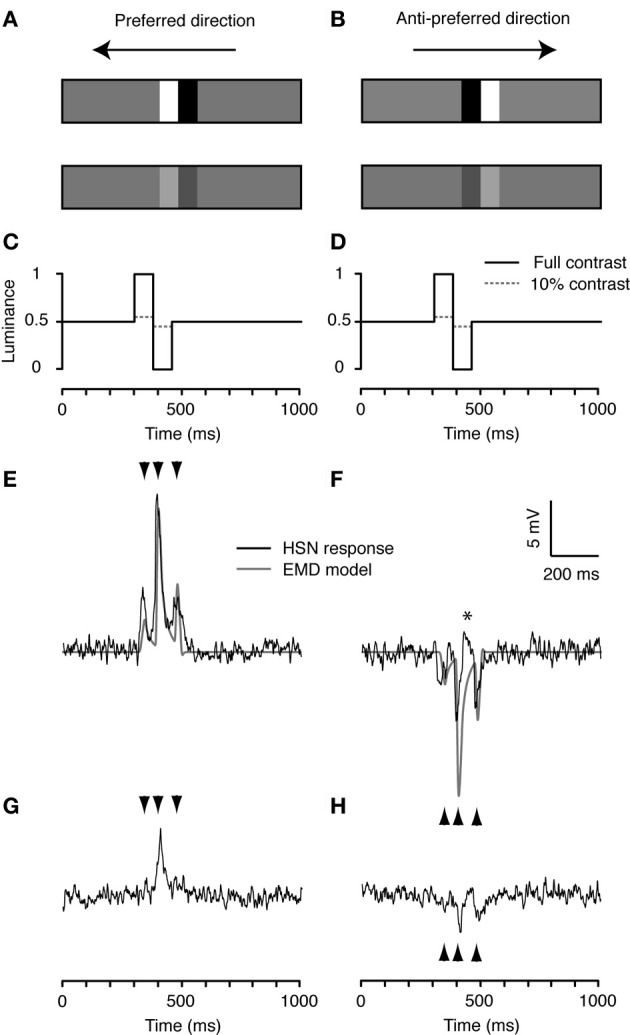
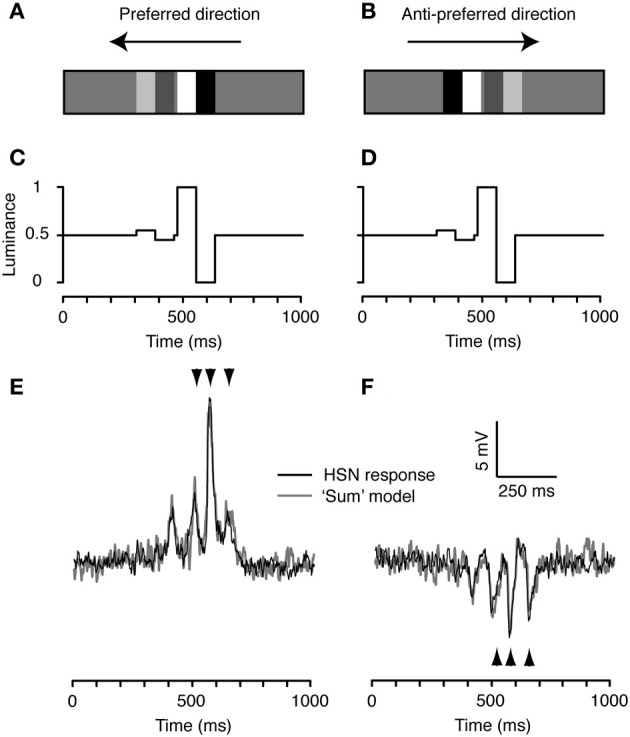
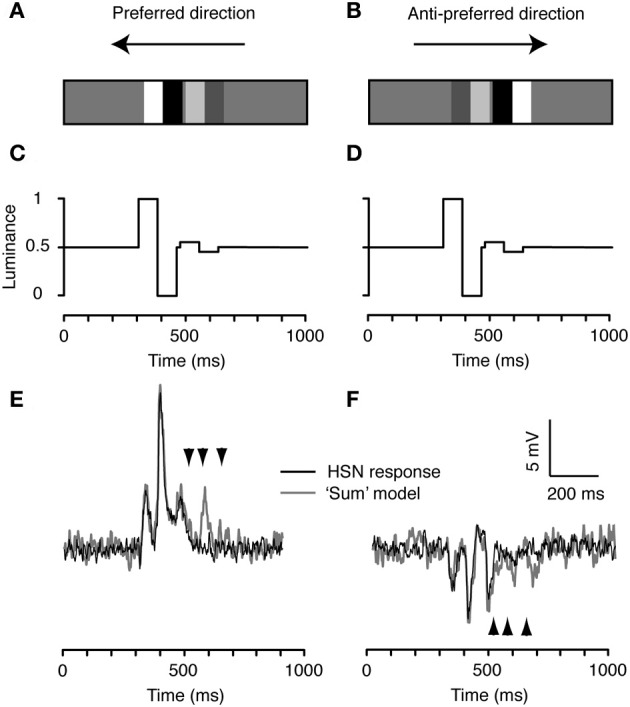
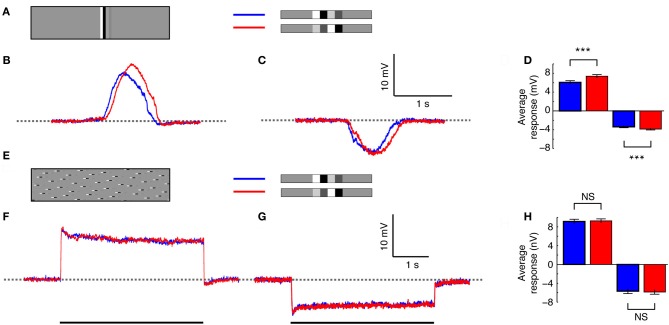
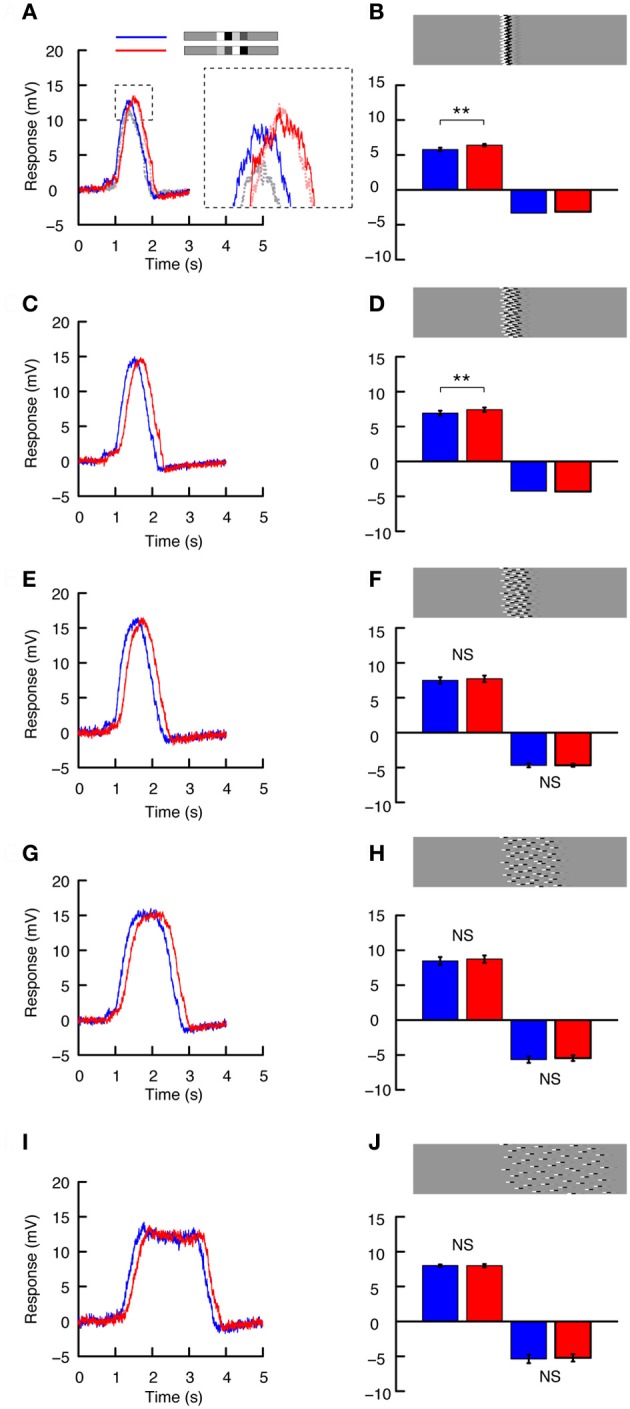
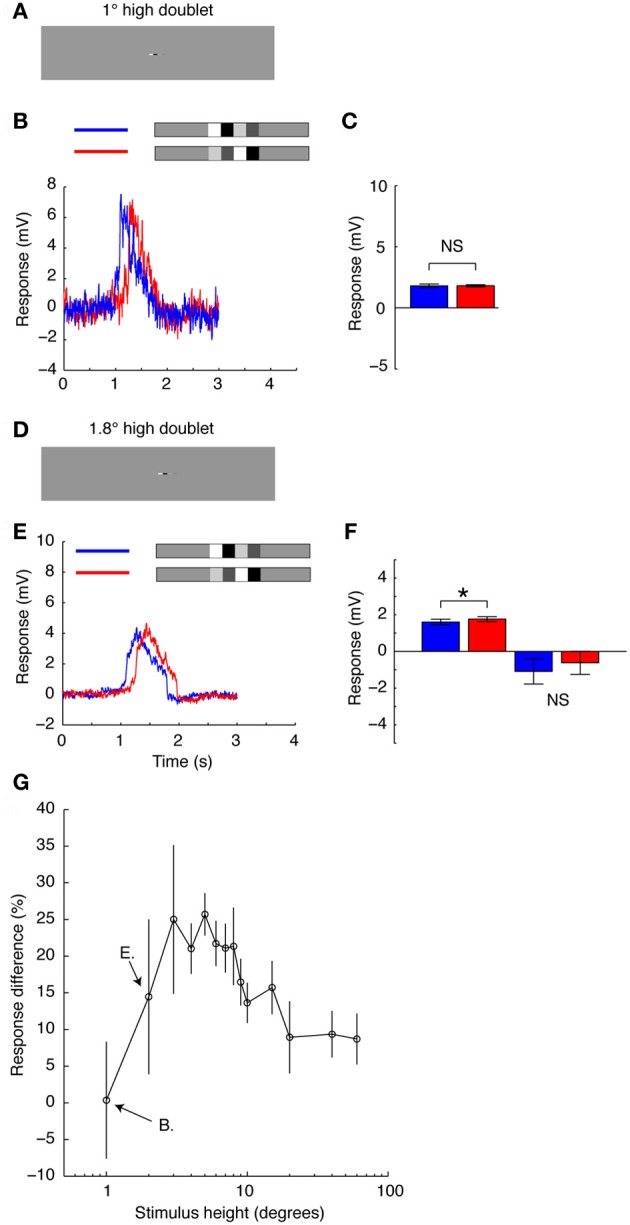
Interpreting visual motion within the natural environment is a challenging task, particularly considering that natural scenes vary enormously in brightness, contrast and spatial structure. The performance of current models for the detection of self-generated optic flow depends critically on these very parameters, but despite this, animals manage to successfully navigate within a broad range of scenes. Within global scenes local areas with more salient features are common. Recent work has highlighted the influence that local, salient features have on the encoding of optic flow, but it has been difficult to quantify how local transient responses affect responses to subsequent features and thus contribute to the global neural response. To investigate this in more detail we used experimenter-designed stimuli and recorded intracellularly from motion-sensitive neurons. We limited the stimulus to a small vertically elongated strip, to investigate local and global neural responses to pairs of local "doublet" features that were designed to interact with each other in the temporal and spatial domain. We show that the passage of a high-contrast doublet feature produces a complex transient response from local motion detectors consistent with predictions of a simple computational model. In the neuron, the passage of a high-contrast feature induces a local reduction in responses to subsequent low-contrast features. However, this neural contrast gain reduction appears to be recruited only when features stretch vertically (i.e., orthogonal to the direction of motion) across at least several aligned neighboring ommatidia. Horizontal displacement of the components of elongated features abolishes the local adaptation effect. It is thus likely that features in natural scenes with vertically aligned edges, such as tree trunks, recruit the greatest amount of response suppression. This property could emphasize the local responses to such features vs. those in nearby texture within the scene.

Keywords: EMD; insect vision; local contrast sensitivity; motion adaptation; motion detection; salient feature; spatial integration.


Figures

Figure 1
Figure 1
Stimulus display modes. (A) The whole screen mode is designed to stimulate large regions of the neuron's receptive field simultaneously, to investigate global response properties. (B) The slit windowed mode limits the stimulus width horizontally, to enable measurement of local response properties. The slit is highlighted with a dashed line for illustration purposes. During experiments there was no border between the slit and the mean-luminance background.
Figure 2
Figure 2
Doublet stimuli. (A,B) A combination of two square-wave, white-black luminance steps on mean luminance (gray) background, referred to as a doublet. The doublet is 14° wide and 75° high and has a fundamental row frequency of 0.053 cycles/°, near optimal for hoverfly HS neurons (Straw et al., 2006). We simulated doublet motion at 90°/s with the doublet at either full or 10% contrast in both the preferred (A) and anti-preferred direction (B). For display purposes the doublets are not shown at their true contrasts or size. (C,D). Normalized time-luminance graphs as seen at the first edge of the slit-window, i.e., the right hand edge for preferred, right-to-left motion, and the left hand edge for anti-preferred left-to-right motion. Solid black lines represent the full contrast condition, dashed gray lines show the 10% original contrast condition. (E) The doublet stimulus produces a characteristic triphasic response from the EMD model in the preferred direction (gray). The neuron's response (black) is also characterized by a triphasic response profile that closely resembles the model output. (F) The EMD output (gray) is similar, but inverted, in the anti-preferred direction. The neuron's response is shown in black. The star (*) indicates a brief depolarization of the membrane potential. (G,H) The neural responses to the low contrast doublet. Arrowheads indicate the timing of the output peaks produced by the model in panels (E,F). Although responses are qualitatively indistinguishable from one recording to the next, absolute response magnitude can vary. To enable accurate comparison of the responses across the six stimulus conditions in Figures 2–4, we show the response to one neuron in which all six conditions were performed, n = 20.
Figure 3
Figure 3
The increasing contrast feature pair. (A) We combined the high and low contrast doublets to produce a pair where the low contrast (10%) doublet is followed by the high contrast doublet, referred to as the increasing contrast doublet pair. (B) The spatial arrangement is flipped for stimulation in the anti-preferred direction, so that the temporal order of doublet contrasts remains the same. (C) Time-luminance trace for motion in the preferred direction. (D) Time-luminance trace for motion in the anti-preferred direction. (E) Intracellular response of an HS neuron to the increasing contrast pair moving in the preferred direction. The gray line indicates the predicted response based on the linear sum of the response to each individual doublet (as in Figure 2). The arrowheads highlight the timing of the three peaks to the second doublet, predicted from the model output (see Figure 2). (F) HS response to the doublet pair moving in the anti-preferred direction. The gray line indicates the linear sum of the response to the individual doublets (see Figure 2). The arrowheads highlight the timing of the three peaks to the second doublet, predicted from the model output. n = 20 from the same neuron as shown in Figures 2 and 4.
Figure 4
Figure 4
The decreasing contrast pair. (A) We combined the high and low contrast doublets to produce an ensemble with the high-contrast doublet preceding the low contrast doublet. (B) The spatial arrangement is flipped for stimulation in the anti-preferred direction so that the temporal order of contrast changes remains the same. (C) Time-luminance trace for motion in the preferred direction. (D) Time-luminance trace for motion in the anti-preferred direction. (E) HS response to the decreasing contrast pair moving in the preferred direction. The gray line indicates the predicted response based on the linear sum of the response to each individual doublet (see Figure 2). The arrowheads highlight the timing of the three peaks to the second doublet, predicted from the model output (see Figure 2). (F) Intracellular response of an HS neuron to the pair moving in the anti-preferred direction. The gray line indicates the linear sum of the response to the individual doublets (see Figure 2). The arrowheads highlight the timing of the three peaks to the second doublet, predicted from the model output. n = 20 from the same neuron as shown in Figures 2 and 3.
Figure 5
Figure 5
Re-distribution of the stimulus. (A) The doublet pairs presented using the whole-screen mode. Blue indicates the decreasing contrast pair, and red the increasing contrast pair. (B) Intracellular HS neuron response to the doublets as they pass through the receptive field in the preferred direction (N = 8, n = 125). (C) Intracellular response to the doublets moving in the anti-preferred direction (N = 6, n = 85). (D) The mean response to the doublets moving in the preferred and anti-preferred direction. ***Indicates a significant difference (p < 0.001, Student's t-test). (E) The doublet pair broken up into individual pseudo-randomly distributed 1.8° high segments. The stimulus was displayed using the whole-screen mode. The same image was used in all recordings, but due to slight differences in receptive field alignment in respect to the CRT display, the stimulus would never have been identically perceived by two flies. (F) Intracellular HS neuron response as the stimulus moves in the preferred direction (N = 7, n = 67). (G) Intracellular HS neuron response as the stimulus moves in the anti-preferred direction (N = 5, n = 51). (H) The mean response to motion in the preferred and anti-preferred direction. NS, no significant difference.
Figure 6
Figure 6
The azimuthal distribution of features. (A) Intracellular HS neuron response to preferred direction motion for the image shown in part B, using the whole screen mode (blue = decreasing contrast, red = increasing contrast). The inset highlights the difference between the responses to this image (B) and that shown in Figure 5B (dashed gray = decreasing contrast, dashed light red = increasing contrast, data from Figure 5B). (B) The doublet pair is broken up into individual 1.8° high segments, which are pseudo-randomly shifted horizontally, so that the maximum horizontal offset is 11° (The absolute spread of the ensembles horizontally is thus, 11° + the doublet pair width, 11° + 30°). The bars show the mean response to motion in the preferred and anti-preferred direction. Npref= 6, n = 65. Nnull= 1, N = 5 (t-test done across repetitions in the single neuron). Stars indicate a significant difference (**p < 0.01, Student's t-test). (C) Response to preferred direction motion of the image shown in (D) Once again, the doublet pairs are broken up into individual 1.8° high segments, which are pseudo-randomly shifted such that the maximum horizontal displacement is 22°. The bars show the mean response to motion in the preferred and anti-preferred direction. Npref= 5, n = 55. Nnull = 1, N = 5 (t-test done across repetitions in the single neuron). Stars indicate a significant difference (**p < 0.01, Student's t-test). (E) As above but for the image shown in (F) The doublet pairs are now distributed over 45°. (F) The bars show the mean response to motion in the preferred and anti-preferred direction. Npref= 5, n = 55. Nnull = 1, N = 5 (t-test done across repetitions in the single neuron, errorbar calculated across n). NS, no significant difference, Student's t-test. (G) As above but for the image shown in H. (H). The doublet pairs are now distributed over 90°. The bars show the net mean response to motion in the preferred and anti-preferred direction. Npref = 5, n = 42. Nnull = 2, n = 13 (t-test done across repetitions independently in the two neurons, errorbar calculated across n). NS, no significant difference, Student's t-test. (I). As above but for the image shown in J. (J) The doublet pairs are now distributed over 180°. The bars show the mean response to motion in the preferred and anti-preferred direction. Npref = 3, n = 27 (t-tests done across repetitions independently in the three neurons, errorbar calculated across n). Nnull = 2, n = 15 (t-tests done across repetitions independently in the two neurons, errorbar calculated across n). NS, no significant difference, Student's t-test.
Figure 7
Figure 7
The vertical extent of a small stimulus. (A) The doublet pairs presented using the whole-screen mode. The doublet pair has the same width as before, but is now only 1° high, just below the size of an individual ommatidium. (B) Intracellular HS neuron response to the doublet pair shown in A, as it passes through the receptive field in the preferred direction (blue = decreasing contrast, red = increasing contrast). (C) The mean response to the doublets as shown in part B. N = 1, n = 9 (t-test done across repetitions in the single neuron, errorbar calculated across n). NS, no significant difference (Student's t-test). (D) The doublet is now 1.8° high. (E) Intracellular HS neuron response to the doublets as they pass through the receptive field in the preferred direction. (F) The mean response to the doublets moving in the preferred and anti-preferred direction. Npref = 4, n = 135. Nnull = 1, n = 20 (t-test done across repetitions in the single neuron, errorbar calculated across n). *Indicates a significant difference (p < 0.05, Student's t-test). NS, no significant difference (Student's t-test). (G) The average response difference between the increasing and decreasing contrast pairs as a function of their vertical extent. A positive difference indicates that the response to the increasing contrast ensemble is larger. N = 1, N = 8 (errorbars calculated across n).

Similar articles

Cited by

References

    1. Arnett D. W. (1972). Spatial and temporal integration properties of units in first optic ganglion of dipterans. J. Neurophysiol. 35, 429–444 - PubMed
    1. Baird E., Srinivasan M. V., Zhang S., Cowling A. (2005). Visual control of flight speed in honeybees. J. Exp. Biol. 208, 3895–3905 10.1242/jeb.01818 - DOI - PubMed
    1. Barnett P. D., Nordström K., O'Carroll D. C. (2010). Motion adaptation and the velocity coding of natural scenes. Curr. Biol. 20, 994–999 10.1016/j.cub.2010.03.072 - DOI - PubMed
    1. Beckers U., Egelhaaf M., Kurtz R. (2009). Precise timing in fly motion vision is mediated by fast components of combined graded and spike signals. Neuroscience 160, 639–650 10.1016/j.neuroscience.2009.02.045 - DOI - PubMed
    1. Borst A., Haag J. (2002). Neural networks in the cockpit of the fly. J. Comp. Physiol. A Neuroethol. Sens. Neural Behav. Physiol. 188, 419–437 10.1007/s00359-002-0316-8 - DOI - PubMed

LinkOut - more resources