. 2012 Oct 16:6:42.
doi: 10.3389/fnana.2012.00042. eCollection 2012.

Communication and wiring in the cortical connectome

Affiliations

Communication and wiring in the cortical connectome

Julian M L Budd et al. Front Neuroanat. .

Abstract

In cerebral cortex, the huge mass of axonal wiring that carries information between near and distant neurons is thought to provide the neural substrate for cognitive and perceptual function. The goal of mapping the connectivity of cortical axons at different spatial scales, the cortical connectome, is to trace the paths of information flow in cerebral cortex. To appreciate the relationship between the connectome and cortical function, we need to discover the nature and purpose of the wiring principles underlying cortical connectivity. A popular explanation has been that axonal length is strictly minimized both within and between cortical regions. In contrast, we have hypothesized the existence of a multi-scale principle of cortical wiring where to optimize communication there is a trade-off between spatial (construction) and temporal (routing) costs. Here, using recent evidence concerning cortical spatial networks we critically evaluate this hypothesis at neuron, local circuit, and pathway scales. We report three main conclusions. First, the axonal and dendritic arbor morphology of single neocortical neurons may be governed by a similar wiring principle, one that balances the conservation of cellular material and conduction delay. Second, the same principle may be observed for fiber tracts connecting cortical regions. Third, the absence of sufficient local circuit data currently prohibits any meaningful assessment of the hypothesis at this scale of cortical organization. To avoid neglecting neuron and microcircuit levels of cortical organization, the connectome framework should incorporate more morphological description. In addition, structural analyses of temporal cost for cortical circuits should take account of both axonal conduction and neuronal integration delays, which appear mostly of the same order of magnitude. We conclude the hypothesized trade-off between spatial and temporal costs may potentially offer a powerful explanation for cortical wiring patterns.

Keywords: Ramón y Cajal; axon; cerebral cortex; communication; connectome; dendrite; networks; optimization.


Figures

Figure 1
Figure 1
Shortest path for the same problem can be different depending on the type of network representation used. An example network consists of four labeled vertices A, B, C, and D. The aim is to find shortest path between vertex A to vertex D. (A) Unweighted network representation. The topology of undirected (left) and directed versions (right) is shown graphically (top) with their corresponding adjacency (connectivity) matrices below (bottom). Brown lines show shortest paths. Red cross indicates a counter-directional edge, which creates an invalid path from vertex A to vertex D. (B) Weighted network representation. Graphical representation (top) of an undirected weighted graph with values of weights (distance) shown next to edges and recorded in the cost or weight matrix below (bottom). Note in the cost or weight matrix the absence of an edge is recorded as an infinite cost (“inf”) while in adjacency matrix it is recorded as zero. (C) Summary table for path length results corresponding to each type of network. Shortest paths are shown in bold brown text.
Figure 2
Figure 2
Spatial and temporal cost trade-off alters arbor morphology. An example network consists of 80 labeled vertices (small yellow filled circles) plus a root vertex (large green filled circle). Here, total wiring cost = spatial cost + (β × temporal cost), where the parameter β, which varies between 0 and 1, is used to trade-off spatial construction cost against temporal routing cost. (A) Artificial arbor structures optimized for different values of a cost trade-off parameter, β = 0.0 (spatial cost optimization, left), 0.8 (mixed cost optimization, middle), and 1.0 (temporal cost optimization, right). (B) Relative communication costs vary as a function of the trade-off parameter. Relative spatial cost (wire length) increases with β rapidly when β > 0.8, while relative temporal cost (path length) steadily decreases with β. Costs at equilibrium around β = 0.8. Artificial arbors were generated using Gastner and Newman (2006) algorithm.
Figure 3
Figure 3
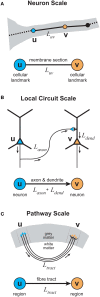
Elementary graphical representations of cortical organization at different spatial scales. (A) Neuron scale. Each vertex represents the location of a cellular landmark obtained from the 3D reconstruction of individual axonal or dendritic arbors (e.g., location of the presynaptic terminal boutons) with an undirected edge representing the section of membrane linking these vertices either by the actual path length or the direct distance between a vertex pair. (B) Local Circuit scale. Each vertex represents the somatic location of a single neuron with a directed (or undirected) edge representing the sum of the axonal and dendritic lengths connecting a pair of neuronal somata. (C) Pathway scale. Each vertex represents a distinct cortical brain region in grey matter with a directed (or undirected) edge representing the axonal fiber tract connecting a pair of cortical regions, where its length describes the actual path or direct distance of its course within white matter.
Figure 4
Figure 4
Communication cost trade-off at Neuron scale of cortical organization. (A) Similar degree of trade-off between path length and wire length economy of intracortical spiny (left) and basket cell axon arbors (right) between corresponding path length optimized star trees and wire length optimized minimal spanning trees (MST), which were all more economical than random arbors (Reprinted from Budd et al., 2010). (B) Examples of spiny pyramidal cell dendritic arbors generated using different trade-off balancing factor (bf) values show that the most realistic looking arbor was obtained for bf = 0.7 (Reprinted from Cuntz et al., 2010). Note bf parameter is equivalent to β parameter in Figure 2.
Figure 5
Figure 5
Communication cost trade-off at Pathway scale of cortical organization. (A,B) Macaque tracer-derived pathway connectivity. (A) Example of directed connectivity (adjacency) matrix of visual and somatomotor macaque cerebral cortex (Reprinted from Sporns et al., 2007), where black squares indicate evidence supporting a axonal pathway connection between areas (matrix rows as sources and columns as target cortical regions). (B) Macaque cerebral cortical network is suboptimal for total axonal length (left) but minimal length network increased averaged path length (right) (Reprinted from Kaiser and Hilgetag, 2006). (C,D) Human DSI-derived pathway connectivity. (C) An undirected spatial cortical network (bottom) is constructed from vertices of cortical regions (top, left) and edges determined from the probability of fiber tracts existing between corresponding pairs of cortical regions based on tractography tracing algorithms (top, right) (Reprinted from Hagmann et al., 2008). (D) Human DSI network is suboptimal for wire length (left) but minimal length network has lower topological dimension than observed cortical network (right) (Reprinted and partly redrawn from Bassett et al., 2010). Topological dimension here is a fractal measure of a network's degree of internal connectedness.
Figure 6
Figure 6
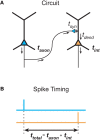
Total communication delay between neurons separable into a presynaptic axonal conduction delay and a postsynaptic neuronal integration delay. (A) Schematic circuit diagram shows the time taken by an action potential generated in the presynaptic neuron (left neuron, blue) to propagate along the axon to a presynaptic terminal, where it causes the release of neurotransmitter into the synaptic cleft, defines the axonal conduction delay (taxon). The postsynaptic neuronal integration delay (tint) is the sum of the time taken for neurotransmitter molecules to induce a local postsynaptic response (synaptic delay, tsyn) and the latency for this response to propagate down the dendritic tree to the axon initial segment, where its integration produces an action potential in the postsynaptic neuron (right neuron, orange) (dendritic delay, tdend). (B) Total delay (ttotal) between the timing of a presynaptic spike occuring (top, blue line) and the generation of a postsynaptic spike (bottom, orange line) is determined by the sum of presynaptic and postsynaptic delay components.
Figure 7
Figure 7
Most estimated intrinsic and extrinsic axonal conduction delays are within an order of magnitude of neuronal integration delays apart from when axons conduct at their slowest rate and neurons operate in a high-conductance state. (A) Intrinsic axon path lengths of spiny neuron within gray matter in adult cat cerebral cortex (n = 22,001 paths from 19 neuron reconstructions). Data taken from Budd et al. (2010). (B) Extrinsic axonal fiber tract lengths in adult macaque cerebral cortex (n = 2309 pathways). Data taken from Kaiser and Hilgetag (2006).

Similar articles

Cited by

References

    1. Achard S., Bullmore E. (2007). Efficiency and cost of economical brain functional networks. PLoS Comput. Biol. 3:e17 10.1371/journal.pcbi.0030017 - DOI - PMC - PubMed
    1. Adams D. L., Sincich L. C., Horton J. C. (2007). Complete pattern of ocular dominance columns in human primary visual cortex. J. Neurosci. 27, 10391–10403 10.1523/JNEUROSCI.2923-07.2007 - DOI - PMC - PubMed
    1. Addison P. S. (1997). Fractals and Chaos: An Illustrated Course. CRC Press. Available online at: http://books.google.com/books?id=l2E4ciBQ9qECandpgis=1
    1. Agmon-Snir H., Segev I. (1993). Signal delay and input synchronization in passive dendritic structures. J. Neurophysiol. 70, 2066–2085 - PubMed
    1. Ahmed B., Anderson J. C., Douglas R. J., Martin K. A., Nelson J. C. (1994). Polyneuronal innervation of spiny stellate neurons in cat visual cortex. J. Comp. Neurol. 341, 39–49 10.1002/cne.903410105 - DOI - PubMed

LinkOut - more resources