. 2012 Oct 9:6:278.
doi: 10.3389/fnhum.2012.00278. eCollection 2012.

Combining EEG and eye tracking: identification, characterization, and correction of eye movement artifacts in electroencephalographic data

Affiliations

Combining EEG and eye tracking: identification, characterization, and correction of eye movement artifacts in electroencephalographic data

Michael Plöchl et al. Front Hum Neurosci. .

Abstract

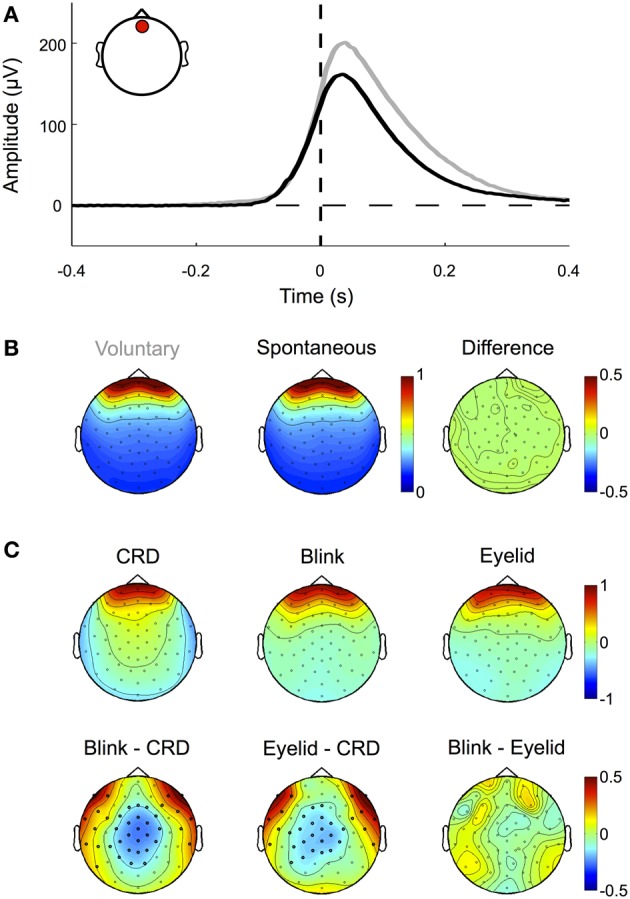
Eye movements introduce large artifacts to electroencephalographic recordings (EEG) and thus render data analysis difficult or even impossible. Trials contaminated by eye movement and blink artifacts have to be discarded, hence in standard EEG-paradigms subjects are required to fixate on the screen. To overcome this restriction, several correction methods including regression and blind source separation have been proposed. Yet, there is no automated standard procedure established. By simultaneously recording eye movements and 64-channel-EEG during a guided eye movement paradigm, we investigate and review the properties of eye movement artifacts, including corneo-retinal dipole changes, saccadic spike potentials and eyelid artifacts, and study their interrelations during different types of eye- and eyelid movements. In concordance with earlier studies our results confirm that these artifacts arise from different independent sources and that depending on electrode site, gaze direction, and choice of reference these sources contribute differently to the measured signal. We assess the respective implications for artifact correction methods and therefore compare the performance of two prominent approaches, namely linear regression and independent component analysis (ICA). We show and discuss that due to the independence of eye artifact sources, regression-based correction methods inevitably over- or under-correct individual artifact components, while ICA is in principle suited to address such mixtures of different types of artifacts. Finally, we propose an algorithm, which uses eye tracker information to objectively identify eye-artifact related ICA-components (ICs) in an automated manner. In the data presented here, the algorithm performed very similar to human experts when those were given both, the topographies of the ICs and their respective activations in a large amount of trials. Moreover it performed more reliable and almost twice as effective than human experts when those had to base their decision on IC topographies only. Furthermore, a receiver operating characteristic (ROC) analysis demonstrated an optimal balance of false positive and false negative at an area under curve (AUC) of more than 0.99. Removing the automatically detected ICs from the data resulted in removal or substantial suppression of ocular artifacts including microsaccadic spike potentials, while the relevant neural signal remained unaffected. In conclusion the present work aims at a better understanding of individual eye movement artifacts, their interrelations and the respective implications for eye artifact correction. Additionally, the proposed ICA-procedure provides a tool for optimized detection and correction of eye movement-related artifact components.

Keywords: EEG; artifact correction; eye movements; eye tracking; independent component analysis (ICA); regression.


Figures

Figure 1
Figure 1
Experimental task. (A) Depending on the stimulus location relative to the fixation cross, subjects performed horizontal and vertical (white arrows) or oblique (red arrows) saccades on the screen. Left: short saccades (11.5° vertical and horizontal, 16.2° oblique) were either performed from the periphery to the center or from the center to the periphery. Right: long saccades (23° vertical and horizontal, 32.5° oblique) were performed from the periphery to another peripheral point located opposite across the center. (B) Each trial started as soon as the subject began to fixate the fixation cross located in one of nine possible locations on the screen. After a variable time of 500–800 ms the stimulus was shown in one of the other eight remaining locations on the screen. In the saccade condition the fixation cross disappeared after another 500–1000 ms, thus serving as the cue for the subject to make a saccade onto the stimulus. (C) In the fixation condition, instead of the fixation cross disappearing, the stimulus was relocated onto the position where the subject fixated.
Figure 2
Figure 2
Component examples and correction procedure. (A) Experimental setup. (B) Examples of five typical IC topographies and their activations, as we found them similarly for all of our subjects. The first three ICs can be classified as eye movement-related as their activations display high variance during saccade intervals (between green and red dotted line), while being inactive during fixation periods (left and right of green and red dotted line). IC 4 on the other hand displays its largest variance during fixation. Therefore, it cannot be attributed to artifacts produced during saccade execution, but instead to neural activity—in this case the time locked visual response to the stimulus. Finally, the topography and signal properties of IC 5 suggest that it emerges from muscle activity or other noise sources at one particular electrode site. The component's activity is not systematically related to saccade execution or stimulus presentation and thus displays similar variance during both, saccade and fixation intervals. Based on these observations we used the variance difference between saccade and fixation periods in each IC to objectively differentiate eye artifact-related ICs from those related to neural activity and other sources.
Figure 3
Figure 3
Visual response. (A) Nose-referenced data. During fixation trials the average ERP over occipital electrode sites displays a clear visual response (upper panel), i.e., an early transient response, followed by a prolonged increase in amplitude. In the gamma frequency range (30–100 Hz, middle panel) power increases from about 180 ms until the end of the trial. Unlike similar responses in earlier studies at source level the power increase here is not restricted to a defined frequency band over its whole time course but also spreads over the whole gamma range in the later portion of the trial. The power increase in the lower frequency range (0–30 Hz, lower panel) broadens in bandwidth coinciding with the transient response in the ERP. (B) Average-referenced data. Similar to (A) the ERP displays an early transient and later prolonged response; however, the signal is smoother with lower amplitudes (upper panel). Compared to the nose referenced data, the prolonged response in the gamma frequency band is now more pronounced and confined to a relatively narrow frequency range (middle panel). Similarly the early visual response in the low frequencies is more pronounced.
Figure 4
Figure 4
Corneo-retinal dipole offsets. (A) Left: ERPs during small (gray traces) and large (black traces) up- and downward saccades as measured at a fronto-central electrode (inset, red circle). The traces show that amplitude and duration of corneo-retinal dipole offsets scale about linearly with saccade size. Right: The normalized topographies during small and large saccades. (B) Small and large horizontal saccades. Same conventions and results as in (A). (C) Topographic differences between different types of saccades: The normalized topographies of small and large saccades in the same vertical (left column) and horizontal (middle column) direction do not display any significant differences, indicating that the linear relationship between saccade size and signal offset holds for all electrode sites. The same is observed for horizontal movements of the same size but opposite directions (right column, top). In the vertical dimension, however, downward saccades produce a significantly larger offsets than upward saccades of the same size (right column, bottom; significant electrodes marked by bold black dots).
Figure 5
Figure 5
Eyelid-induced signal changes. (A) ERP traces for voluntary (gray) and spontaneous (black) blinks measured at a frontal electrode (inset, red circle). Voluntary blinks are of longer duration and result in higher amplitudes than involuntary blinks. Note that blink onset as defined by the eye tracker (time 0, vertical dashed line) corresponds to the point at which the pupil is not visible anymore. The actual eyelid movement already starts around 100 ms earlier, when the signal deflects from the zero line (horizontal dashed line). (B) Although spontaneous and voluntary blinks differ in amplitude and duration, they share the same topographic pattern (i.e., the normalized amplitude distribution across the scalp). (C) Topographic patterns of corneo-retinal dipole offsets related to upward saccades, blinks, and post-saccadic eyelid movements (upper row) and the differences between them (lower row). Bold black dots indicate electrode sites with statistical significant differences. The results show that corneo-retinal dipole offsets produce a topographic pattern that differs from both, blinks and post-saccadic eyelid movements, while no differences were found between the latter two. This suggests that blinks and post-saccadic eyelid movements are produced by the same electrophysiological source.
Figure 6
Figure 6
Saccadic spike potential. (A) After removal of the corneo-retinal dipole by high pass filtering the data at 30 Hz, the spike potential displays a biphasic shape at all scalp electrodes (colored traces). Without filtering the ERP traces for up- (upper inset) and downward (lower inset) saccades show that the negative deflection of the spike potential is largely occluded by the manifold larger corneo-retinal dipole offset. (B) Average referencing reduces the amplitude of the spike potential at scalp electrodes and leads to increased negativity around the eyes. (C) Differences of topographic patterns for spike potentials related to saccades in the same axis but opposite directions. Comparing spike potentials related to up- and downward saccades of the same size results in significant amplitude differences at almost all scalp electrodes, indicating that downward saccades produce higher spike potential amplitudes. The difference between left and rightward saccades yields significant values at electrode sites close to the eyes. However, no significant differences were found between spike potentials related to ipsi- and contralateral saccades, suggesting that the topographic differences for saccades with the same size and along the same axis may be not so much related to the spike potential's amplitude itself but rather to eye position (i.e., the direction of the corneo-retinal dipole) before saccade onset. (D) Spike potential topographies for different saccade directions (columns) and sizes (rows). A two-way ANOVA reveals that peak amplitudes of the spike potential are higher for down- than for upward saccades while they are not significantly different between left and rightward saccades. Smaller saccades from the periphery to the center result in higher spike potential amplitudes than saccades of the same size but performed from the center to the periphery. Surprisingly saccades from the periphery to the center do not show significant differences to long saccades (i.e., saccades performed from the periphery across the center to another peripheral location). This indicates that the peak amplitude of spike potentials may depend on initial eye position, rather than on saccade size.
Figure 7
Figure 7
Microsaccades. (A) Mainsequence. Plotting microsaccade amplitudes against microsaccade velocities results in a straight line on a log/log scale (i.e., the mainsequence). This relationship is a signature for ballistic eye movements, thus confirming the physiological origin of the microsaccades detected here. (B) Histogram of the microsaccade distribution over all fixation trials. After stimulus onset the frequency of microsaccades decreases, followed by a rebound starting at around 200 ms and peaking 370 ms after stimulus onset. (C) ERP aligned to microsaccade onset. At scalp electrodes microsaccades display a similar biphasic pattern as the saccadic spike potential, suggesting that the most prominent contribution of microsaccades to the signal measured on the scalp is produced by spike potentials going along with eye movement. (D) Time-frequency signature of microsaccades. The sharp peak of the microsaccade-related spike potential results in a transient broadband power burst that spans over the entire gamma frequency range (30–100 Hz). (E) Reduction of microsaccade-related artifacts in the time domain. The ICA-based correction procedure proposed here diminishes the microsaccade-related spike potential to about one third of its original amplitude. (F) Reduction of microsaccade-related artifacts in the frequency domain. Corresponding to what was observed for the ERP, the correction procedure substantially reduces the spike potential-related frequency signature in the gamma band.
Figure 8
Figure 8
Evaluation of the IC selection procedure. (A) Distribution of saccade/fixation variance ratios. The magnification in the inset illustrates that the ratios are not clearly bimodally distributed. Therefore the threshold that optimally separates eye movement-related ICs from non-ocular ICs is difficult to determine. Based on heuristics, that is after inspecting IC activations that had a ratio above one and that we considered likely to be eye movement-related, we set the threshold to a ratio of 1.1. (B) ROC analysis. ROC curves are graphical illustrations of how well two different classes (here: eye movement-related ICs vs. non-eye movement-related ICs) can be separated depending on the threshold of the discrimination criterion (here: the ratio between the variance in saccade and fixation intervals). Each point on the blue curve represents the saccade/fixation variance ratio of one IC starting with the highest (63.71) in the lower left corner and ending with the lowest (0.04) in the upper right corner. If ICs could be unequivocally separated into being eye- or non-eye-related solely based on their variance ratio, lowering the threshold would include more and more eye movement ICs (as determined by expert tagging) until a true positive rate of 100% is reached. Subsequently by further lowering the threshold more and more non-eye movement-related components would be included in the selection. In this case the blue curve would be identical with the red line. Conversely, if the variance ratio would not provide any information about the IC's relation to eye movements, the blue curve would follow the black dashed line. The area under curve (AUC), which is obtained by computing the area between the blue and the black dashed line, quantifies how well eye movement-related ICs are separated from other ICs only based on their saccade/fixation variance ratio. An AUC value of 1 indicates perfect discrimination and a value of 0.5 indicates random performance. Here we observed an AUC value of more than 0.99. (C) ROC curve detail. The green arrow indicates the the optimal threshold for separating the ICs into two classes. It is given by the point at which further lowering the threshold would include more false positives than true positives. Here it has a value of 1.11 and is thus very close to our pre-determined threshold. The red arrow indicates the threshold at which all eye movement-related ICs are included in the selection. The corresponding ratio is 0.99.
Figure 9
Figure 9
ERP correction. ERP traces for uncorrected data (blue), data corrected based on two (green) and three (black) component regression models and ICA corrected data (red). Rows show the ERPs measured at frontal (top), central (middle), and occipital (bottom) scalp locations and the red circles in the head plots on the left indicate the respective electrode sites. Columns correspond to up-, down-, and rightward saccades, blinks and fixation trials with and without detected microsaccades, respectively. Time 0 represents saccade and blink onset as determined by the eye tracker and stimulus presentation in fixation trials. The traces suggest that regression tends to over- or under-correct the data. ICA on the other hand efficiently removes corneo-retinal dipole offsets and eyelid artifacts, while the visual response is still clearly seen in occipital channels. However, ICA fails to entirely remove the spike potential at saccade onset but still reduces it substantially. In the fixation condition including microsaccades the raw and the ICA corrected data display significant differences (shaded area) in the time interval after 198 ms, but the distribution of microsaccades over all trials (bottom row) suggests that a significant portion of these differences can be attributed to the reduction of microsaccade-related artifacts. This is supported by the observation that in fixation trials without detected microsaccades, the difference between raw and ICA corrected data is smaller and only becomes significant after 278 ms. The topography of this difference resembles the one of the saccadic spike potential and may therefore be related to undetected microsaccades.
Figure 10
Figure 10
Correction in the time-frequency domain. (A) Correction of eye movement artifacts in the high (larger boxes) and low (smaller boxes) frequency ranges at frontal (top panel), central (second panel), and occipital (bottom panel) electrode sites. Left column: In the high frequencies (30–100 Hz) the uncorrected data display the typical broadband gamma burst-related to the spike potential at saccade onset. Corresponding with the topography of the spike potential this burst is most pronounced at central and occipital channel locations. As a result of small correctional saccades, a similar but much weaker burst is observed about 180 ms after fixation onset. In the low frequencies (<30 Hz) the corneo-retinal dipole offset leads to a prolonged increase in power below 10 Hz, which is starting at saccade onset and manifests itself most prominently at frontal electrode sites. Right column: In concordance with the observation for ERP data, ICA correction significantly reduces the spike potential-related gamma burst and completely removes the power increase related to corneo-retinal dipole offsets. (B) Correction of eye movement artifacts at occipital electrode sites on a more detailed color scale. Left column: The second broadband burst in the gamma range, which is caused by correctional saccades occludes the prolonged visual response we found earlier during fixation trials. Similarly, with the more detailed color scale confounds produced by the spike potential are also observed in the low frequency range and together with the corneo-retinal dipole-related power increase, the early visual response that is observed in the ERP is largely occluded. Right column: The more detailed color scale confirms that ICA completely removes corneo-retinal dipole induced power changes, while the spike potential still visible for both, task-related and correctional saccades. However, the removal of corneo-retinal dipole offsets and reduction of the spike potential renders the visual responses clearly visible in both the low and high frequencies.
Figure 11
Figure 11
Differences between uncorrected and ICA corrected time frequency data during fixation trials. (A) Same conventions as in Figure 9. Left column: In the uncorrected data a prominent broadband gamma power increase is observed at central electrode sites. Occipital channels display prolonged activity in the gamma range corresponding to the late visual response as described in Figure 3. Middle column: In the corrected data the prolonged visual gamma response is confined to a frequency band between approximately 50 and 80 Hz and its peak now also visible in central channels. The low frequencies reveal a distinct peak at around 9 Hz corresponding to the early transient response in the ERP. Right column: Comparing the difference between corrected and uncorrected data with the distribution of microsaccades indicates that the significant portions of the observed differences (i.e., bins in original color; non-significant bins are gray shaded) follow the pattern of microsaccade distribution very closely. The negative gamma power difference after stimulus onset results from a drop in microsaccade rate relative to the pre-stimulus interval, which here serves as the baseline. Then coinciding with the increase in microsaccade rate after 250 ms the difference in gamma power substantially increases. (B) In trials without detected microsaccades the largest part of the broadband gamma power increase disappears and smaller differences between raw and ICA corrected data only become significant after 300 ms. Again these residual differences display the spatial and spectral signatures of the saccadic spike potential and therefore are likely the result of undetected microsaccades.

Similar articles

Cited by

References

    1. Antervo A., Hari R., Katila T., Ryhänen T., Seppänen M. (1985). Magnetic fields produced by eye blinking. Electroencephalogr. Clin. Neurophysiol. 61, 247–253 - PubMed
    1. Arden G., Kelsey J. (1962). Changes produced by light in the standing potential of the human eye. J. Physiol. 161, 189–204 - PMC - PubMed
    1. Arden G. B., Constable P. A. (2006). The electro-oculogram. Prog. Retin. Eye Res. 25, 207–248 10.1016/j.preteyeres.2005.11.001 - DOI - PubMed
    1. Armington J. C. (1978). Potentials that precede small saccades, in Visual Psychophysics and Physiology, eds Armington J. C., Krauskopf J., Wooten B. R. (New York, NY: Academic Press; ), 363–372
    1. Barry W., Jones G. M. (1965). Influence of eye lid movement upon Electro-Oculographic recording of vertical eye movements. Aerosp. Med. 36, 855–858 - PubMed