. 2012 Oct 11:6:281.
doi: 10.3389/fnhum.2012.00281. eCollection 2012.

Parallel ICA identifies sub-components of resting state networks that covary with behavioral indices

Affiliations

Parallel ICA identifies sub-components of resting state networks that covary with behavioral indices

Timothy B Meier et al. Front Hum Neurosci. .

Abstract

Parallel Independent Component Analysis (para-ICA) is a multivariate method that can identify complex relationships between different data modalities by simultaneously performing Independent Component Analysis on each data set while finding mutual information between the two data sets. We use para-ICA to test the hypothesis that spatial sub-components of common resting state networks (RSNs) covary with specific behavioral measures. Resting state scans and a battery of behavioral indices were collected from 24 younger adults. Group ICA was performed and common RSNs were identified by spatial correlation to publically available templates. Nine RSNs were identified and para-ICA was run on each network with a matrix of behavioral measures serving as the second data type. Five networks had spatial sub-components that significantly correlated with behavioral components. These included a sub-component of the temporo-parietal attention network that differentially covaried with different trial-types of a sustained attention task, sub-components of default mode networks that covaried with attention and working memory tasks, and a sub-component of the bilateral frontal network that split the left inferior frontal gyrus into three clusters according to its cytoarchitecture that differentially covaried with working memory performance. Additionally, we demonstrate the validity of para-ICA in cases with unbalanced dimensions using simulated data.

Keywords: behavior; parallel ICA; resting state fMRI; resting state networks.


Figures
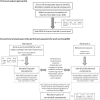
Figure 1
Figure 1
Displayed is a flow chart of the methods used for this study. MC and * indicate where steps were taken to limit multiple comparisons (MC). For in depth description of para-ICA analysis see the following papers (Calhoun et al., ; Liu et al., 2009).
Figure 2
Figure 2
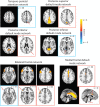
Shown above are the RSNs identified by Allen et al. and the component from our group ICA that had the highest spatial correlation to the Allen et al. templates (2011). In this figure, for the templates the threshold is set at t = 45 and for the matching components from our data the threshold is set at z = 3.0.
Figure 3
Figure 3
This is an example of the correlation across subjects between the z-scaled loading parameters for a behavioral component and the z-scaled loading parameters of a spatial component that resulted from the para-ICA run for the posterior–inferior default mode network.
Figure 4
Figure 4
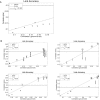
Displayed are the simulated data results comparing the correlations derived from para-ICA to the ground truth correlations in data with highly unbalanced data dimensions in cases of sub-threshold correlations between data modalities (A) and in cases with varying supra-threshold correlations between modalities (B). The dotted horizontal line reflects the constrained connections parameter (r_th) and the dotted diagonal line reflects a perfect match between the ground truth and the para-ICA derived correlations. Para-ICA treats data-modalities with only sub-threshold correlations as having no inter-modal relationship (as seen in A). When the correlation between pairs of components exceeds r_th, these components are updated in the para-ICA algorithm (as circled in B). A maximum of three sub-threshold pairs can be updated in the para-ICA framework. Error bars represent standard deviation based on 100 iterations. Note that error bars of (A) overlap with the data points and are hard to see due to low standard deviations.
Figure 5
Figure 5
For each RSN that had significant para-ICA correlations, the RSN from our group ICA is displayed on black background, while the spatial component resulting from the para-ICA is displayed on white background. Spatial components with blue borders represent components with negative loadings while those with red borders represent components with positive loadings. Red arrows are included to direct the reader to the spatial components. Only voxels with loading parameter z > 1.96 (p < 0.05) are shown.

Similar articles

Cited by

References

    1. Allen E. A., Erhardt E. B., Damaraju E., Gruner W., Segall J. M., Silva R. F., et al. (2011). A baseline for the multivariate comparison of resting-state networks. Front. Syst. Neurosci. 5:2 10.3389/fnsys.2011.00002 - DOI - PMC - PubMed
    1. Anticevic A., Repovs G., Shulman G. L., Barch D. M. (2010). When less is more: TPJ and default network deactivation during encoding predicts working memory performance. Neuroimage 49, 2638–2648 10.1016/j.neuroimage.2009.11.008 - DOI - PMC - PubMed
    1. Badre D., Poldrack R. A., Pare-Blagoev E. J., Insler R. Z., Wagner A. D. (2005). Dissociable controlled retrieval and generalized selection mechanisms in ventrolateral prefrontal cortex. Neuron 47, 907–918 10.1016/j.neuron.2005.07.023 - DOI - PubMed
    1. Badre D., Wagner A. D. (2007). Left ventrolateral prefrontal cortex and the cognitive control of memory. Neuropsychologia 45, 2883–2901 10.1016/j.neuropsychologia.2007.06.015 - DOI - PubMed
    1. Banich M. T., Milham M. P., Atchley R., Cohen N. J., Webb A., Wszalek T., et al. (2000). fMri studies of Stroop tasks reveal unique roles of anterior and posterior brain systems in attentional selection. J. Cogn. Neurosci. 12, 988–1000 - PubMed