

Implications of fidelity difference between the leading and the lagging strand of DNA for the acceleration of evolution
- PMID: 23087905
- PMCID: PMC3472163
- DOI: 10.3389/fonc.2012.00144
Implications of fidelity difference between the leading and the lagging strand of DNA for the acceleration of evolution
Abstract
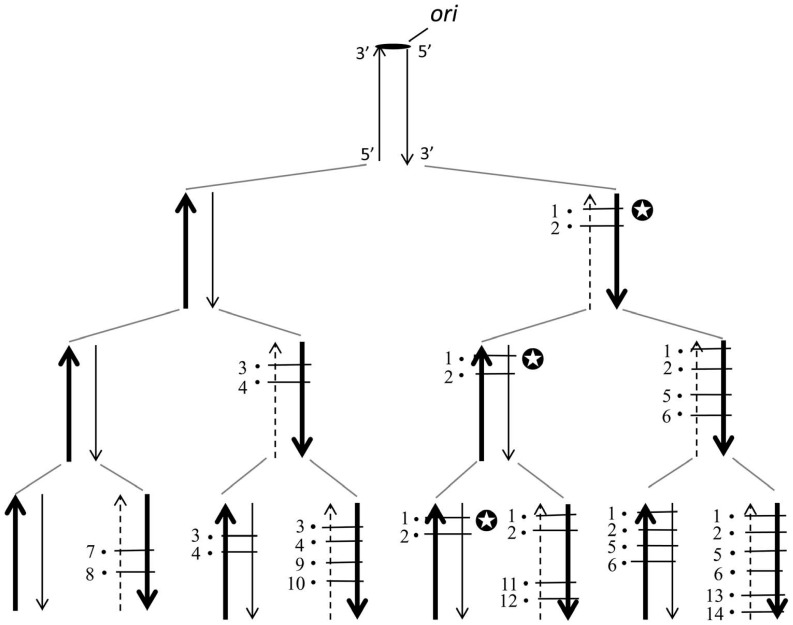
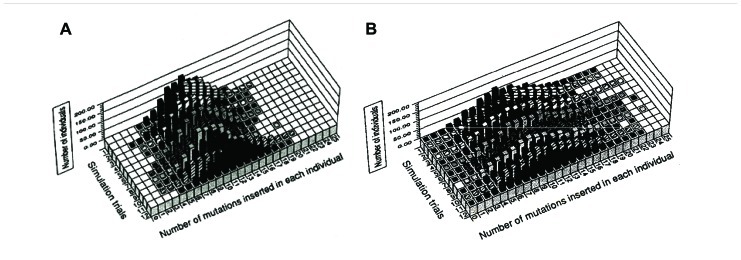
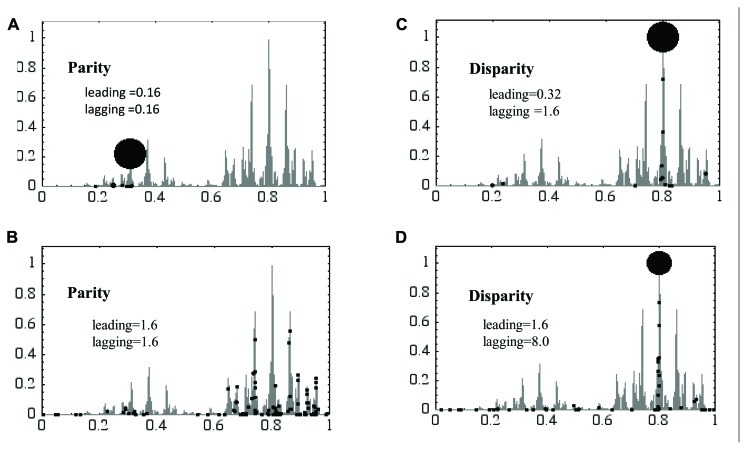
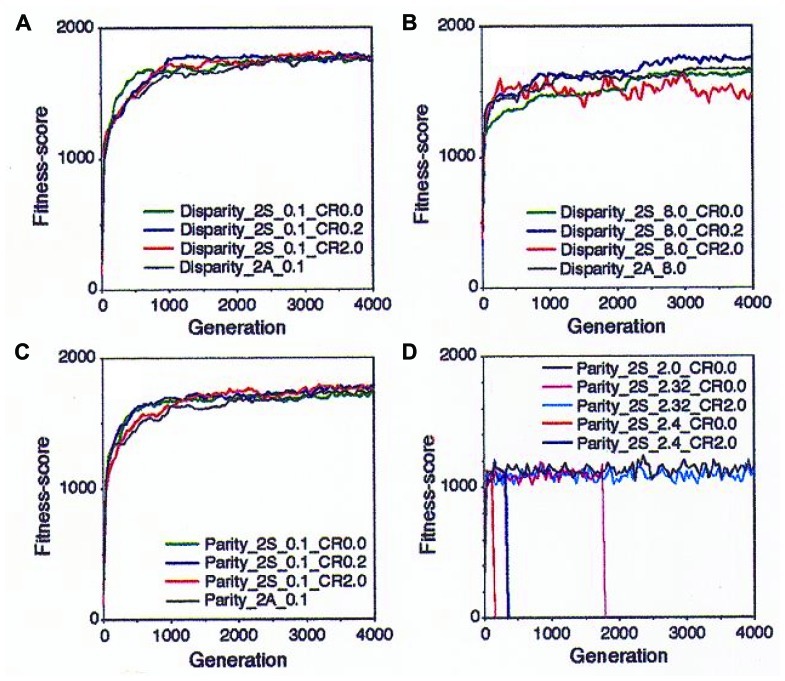
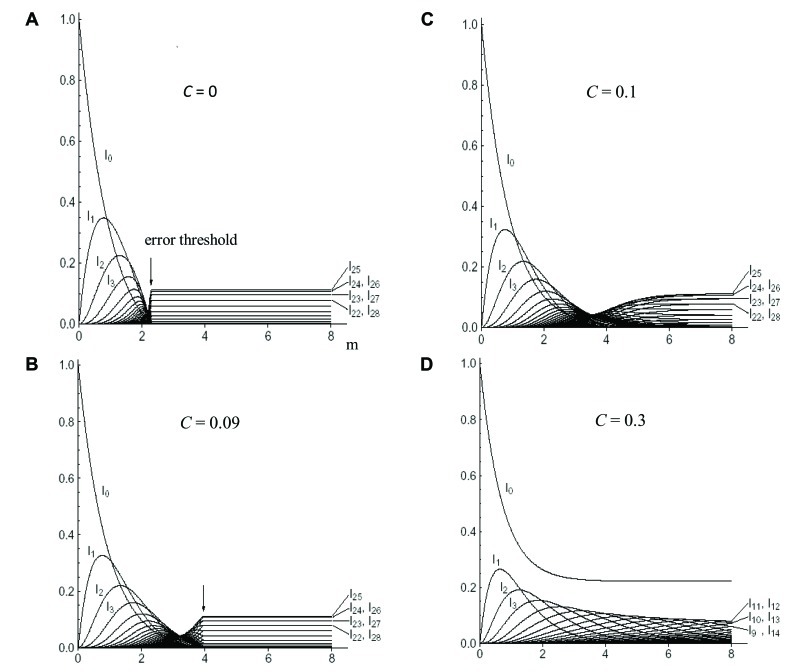
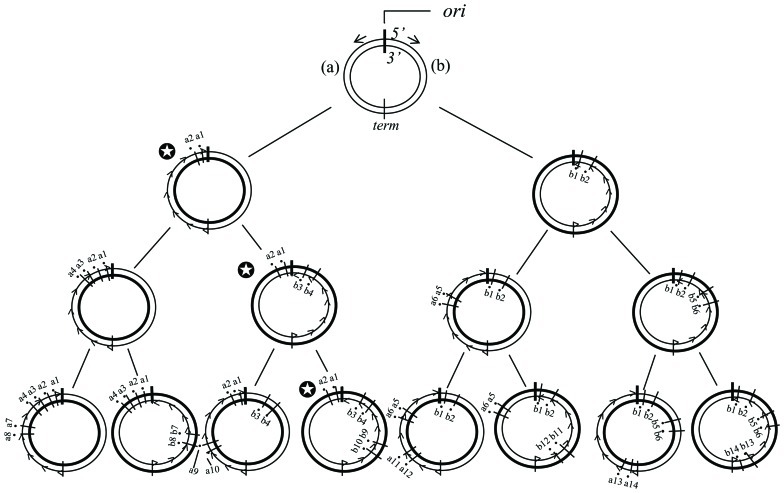
Without exceptions, genomic DNA of living organisms is replicated using the leading and the lagging strand. In a conventional idea of mutagenesis accompanying DNA replication, mutations are thought to be introduced stochastically and evenly into the two daughter DNAs. Here, however, we hypothesized that the fidelity of the lagging strand is lower than that of the leading strand. Our simulations with a simplified model DNA clearly indicated that, even if mutation rates exceeded the so-called threshold values, an original genotype was guaranteed in the pedigree and, at the same time, the enlargement of diversity was attained with repeated generations. According to our lagging-strand-biased-mutagenesis model, mutator microorganisms were established in which mutations biased to the lagging strand were introduced by deleting the proofreading activity of DNA polymerase. These mutators ("disparity mutators") grew normally and had a quick and extraordinarily high adaptability against very severe circumstances. From the viewpoint of the fidelity difference between the leading and the lagging strand, the basic conditions for the acceleration of evolution are examined. The plausible molecular mechanism for the faster molecular clocks observed in birds and mammals is discussed, with special reference to the accelerated evolution in the past. Possible applications in different fields are also discussed.
Keywords: acceleration; biased-mutagenesis; evolution; leading/lagging strand; polymerase δ; proofreading; replicore.
Figures
Similar articles
-
A differential equation, deduced from a DNA-type genetic algorithm with the lagging-strand-biased mutagenesis.Heliyon. 2022 Mar 26;8(3):e09155. doi: 10.1016/j.heliyon.2022.e09155. eCollection 2022 Mar. Heliyon. 2022. PMID: 35368546 Free PMC article.
-
The disparity mutagenesis model predicts rescue of living things from catastrophic errors.Front Genet. 2014 Dec 4;5:421. doi: 10.3389/fgene.2014.00421. eCollection 2014. Front Genet. 2014. PMID: 25538731 Free PMC article. Review.
-
Asymmetrical DNA replication promotes evolution: disparity theory of evolution.Genetica. 1998;102-103(1-6):333-47. Genetica. 1998. PMID: 9766961
-
Replication error rates for G.dGTP, T.dGTP, and A.dGTP mispairs and evidence for differential proofreading by leading and lagging strand DNA replication complexes in human cells.J Biol Chem. 1995 Feb 10;270(6):2595-600. doi: 10.1074/jbc.270.6.2595. J Biol Chem. 1995. PMID: 7852323
-
DNA-directed mutations. Leading and lagging strand specificity.Ann N Y Acad Sci. 1999 May 18;870:173-89. doi: 10.1111/j.1749-6632.1999.tb08878.x. Ann N Y Acad Sci. 1999. PMID: 10415482 Review.
Cited by
-
A differential equation, deduced from a DNA-type genetic algorithm with the lagging-strand-biased mutagenesis.Heliyon. 2022 Mar 26;8(3):e09155. doi: 10.1016/j.heliyon.2022.e09155. eCollection 2022 Mar. Heliyon. 2022. PMID: 35368546 Free PMC article.
-
The Inherent Asymmetry of DNA Replication.Annu Rev Cell Dev Biol. 2017 Oct 6;33:291-318. doi: 10.1146/annurev-cellbio-100616-060447. Epub 2017 Aug 11. Annu Rev Cell Dev Biol. 2017. PMID: 28800257 Free PMC article. Review.
-
Disparity mutagenesis model possesses the ability to realize both stable and rapid evolution in response to changing environments without altering mutation rates.Heliyon. 2016 Aug 17;2(8):e00141. doi: 10.1016/j.heliyon.2016.e00141. eCollection 2016 Aug. Heliyon. 2016. PMID: 27579448 Free PMC article.
-
The disparity mutagenesis model predicts rescue of living things from catastrophic errors.Front Genet. 2014 Dec 4;5:421. doi: 10.3389/fgene.2014.00421. eCollection 2014. Front Genet. 2014. PMID: 25538731 Free PMC article. Review.
-
Viral genome sequence datasets display pervasive evidence of strand-specific substitution biases that are best described using non-reversible nucleotide substitution models.Res Sq [Preprint]. 2022 Dec 29:rs.3.rs-2407778. doi: 10.21203/rs.3.rs-2407778/v1. Res Sq. 2022. PMID: 36597548 Free PMC article. Preprint.
References
-
- Abe H., Fujita Y., Chiba Y., Jigami Y., Nakayama K. (2009a). Upregulation of genes involved in gluconeogenesis and the glyoxylate cycle suppressed the drug sensitivity of an N-glycan-deficient Saccharomyces cerevisiae mutant. Biosci. Biotechnol. Biochem. 73 1398–1403 - PubMed
-
- Abe H., Fujita Y., Takaoka Y., Kurita E., Yano S., Tanaka N., et al. (2009b). Ethanol-tolerant Saccharomyces cerevisiae strains isolated under selective conditions by over-expression of a proofreading-deficient DNA polymerase delta. J. Biosci. Bioeng. 108 199–204 - PubMed
-
- Abe H., Takaoka Y., Chiba Y., Sato N., Ohgiya S., Itadani A., et al. (2009c). Development of valuable yeast strains using a novel mutagenesis technique for the effective production of therapeutic glycoproteins. Glycobiology 19 428–436 - PubMed
-
- Aoki K., Furusawa M. (2003). Increase in error threshold for quasispecies by heterogeneous replication accuracy. Phys. Rev. E Stat. Nonlin. Soft Matter Phys. 68(Pt 1) 031904 - PubMed
LinkOut - more resources
Full Text Sources
Miscellaneous