. 2012 Oct 17:2:128.
doi: 10.3389/fcimb.2012.00128. eCollection 2012.

Diverse phosphorylation patterns of B cell receptor-associated signaling in naïve and memory human B cells revealed by phosphoflow, a powerful technique to study signaling at the single cell level

Affiliations

Diverse phosphorylation patterns of B cell receptor-associated signaling in naïve and memory human B cells revealed by phosphoflow, a powerful technique to study signaling at the single cell level

Franklin R Toapanta et al. Front Cell Infect Microbiol. .

Abstract

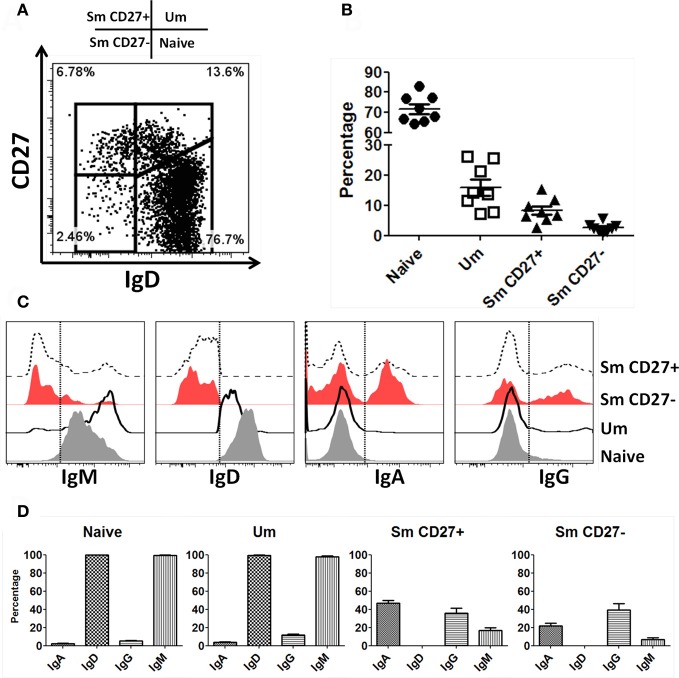
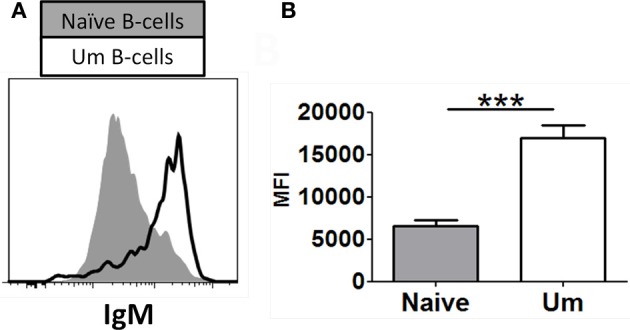
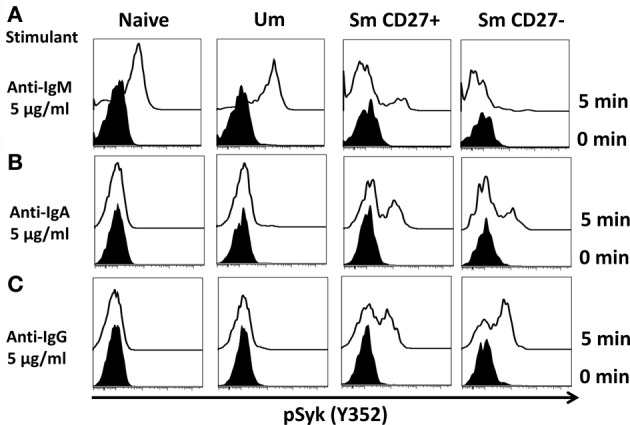
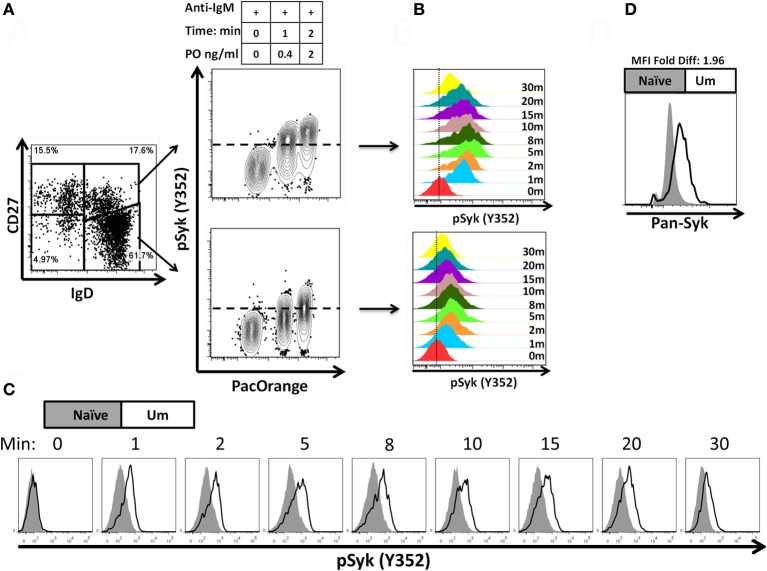
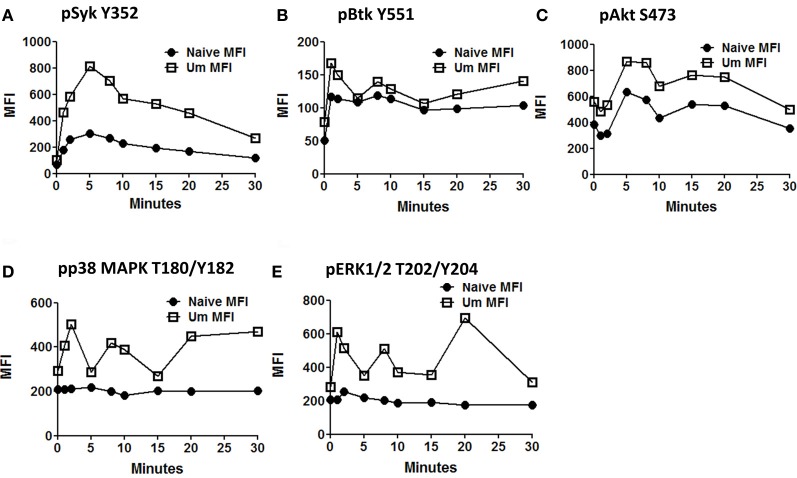
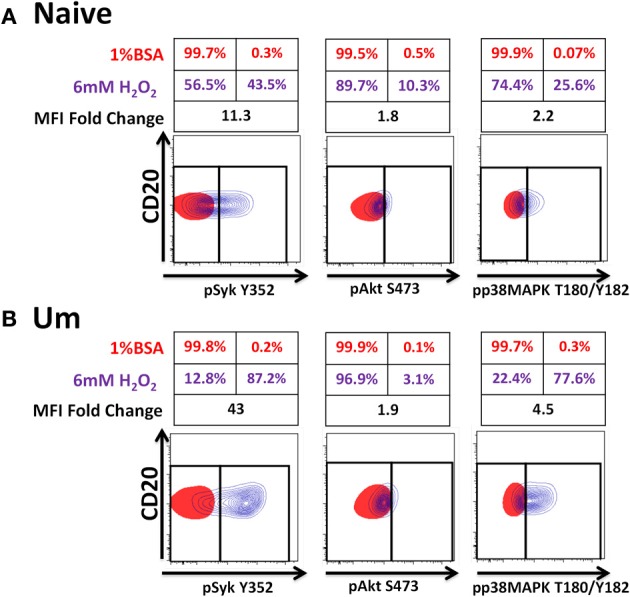
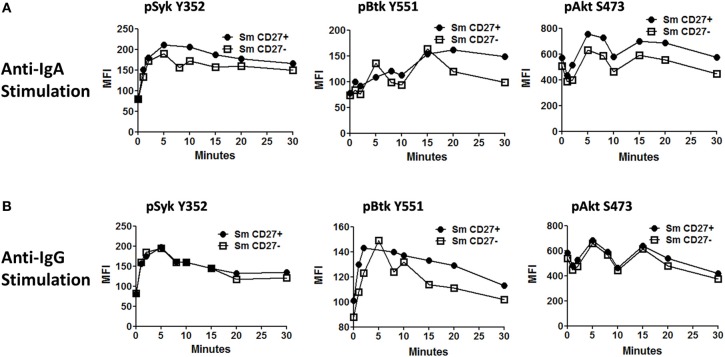
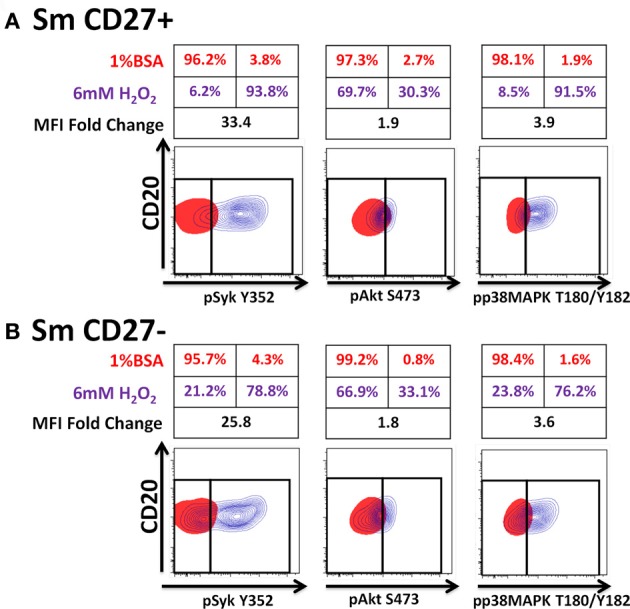
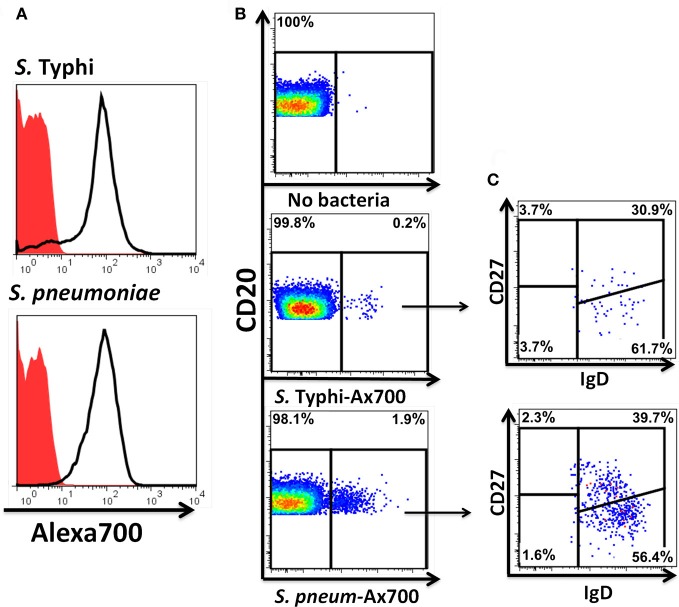
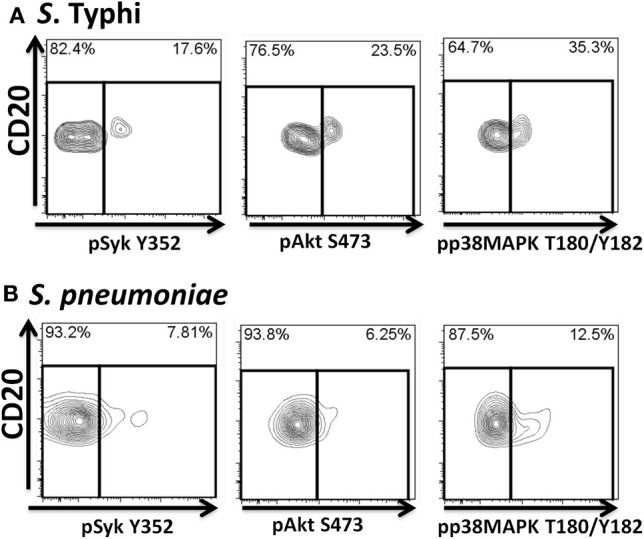
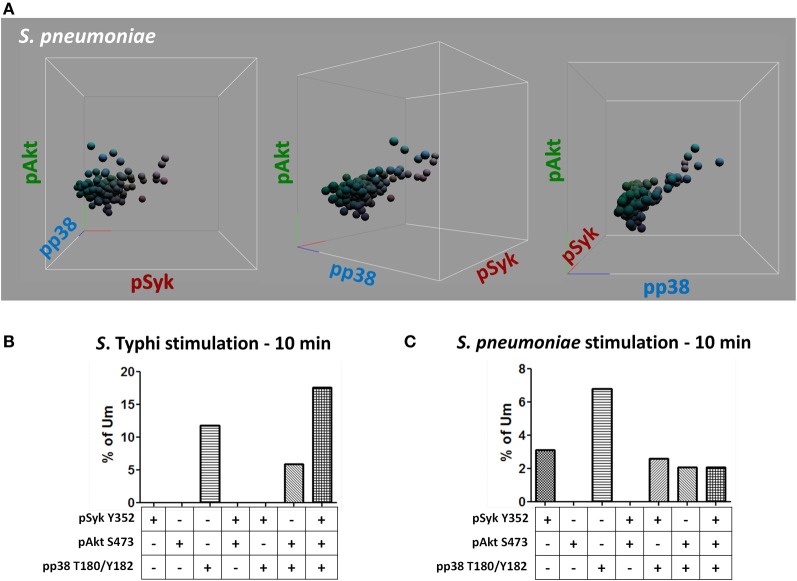
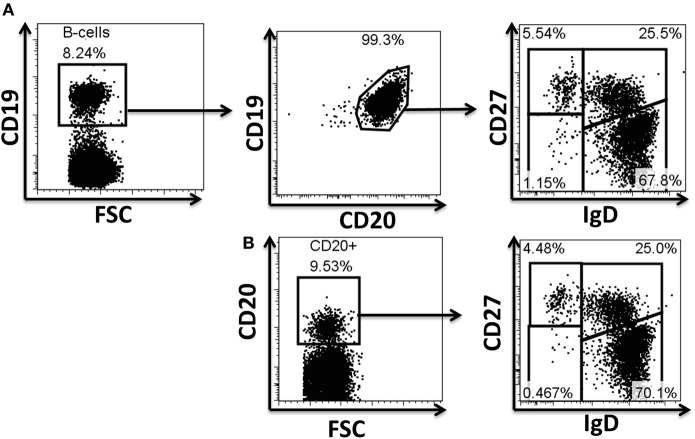
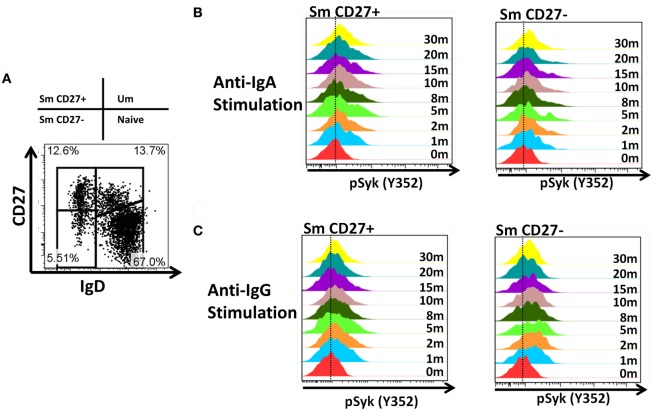
Following interaction with cognate antigens, B cells undergo cell activation, proliferation, and differentiation. Ligation of the B cell receptor (BCR) leads to the phosphorylation of BCR-associated signaling proteins within minutes of antigen binding, a process with profound consequences for the fate of the cells and development of effector immunity. Phosphoflow allows a rapid evaluation of various signaling pathways in complex heterogenous cell subsets. This novel technique was used in combination with multi-chromatic flow cytometry (FC) and fluorescent-cell barcoding (FCB) to study phosphorylation of BCR-associated signaling pathways in naïve and memory human B cell subsets. Proteins of the initiation (Syk), propagation (Btk, Akt), and integration (p38MAPK and Erk1/2) signaling units were studied. Switched memory (Sm) CD27+ and Sm CD27- phosphorylation patterns were similar when stimulated with anti-IgA or -IgG. In contrast, naïve and unswitched memory (Um) cells showed significant differences following IgM stimulation. Enhanced phosphorylation of Syk was observed in Um cells, suggesting a lower activation threshold. This is likely the result of higher amounts of IgM on the cell surface, higher pan-Syk levels, and enhanced susceptibility to phosphatase inhibition. All other signaling proteins evaluated also showed some degree of enhanced phosphorylation in Um cells. Furthermore, both the phospholipase C-γ2 (PLC-γ2) and phosphatidylinositol 3-kinase (PI3K) pathways were activated in Um cells, while only the PI3K pathway was activated on naïve cells. Um cells were the only ones that activated signaling pathways when stimulated with fluorescently labeled S. Typhi and S. pneumoniae. Finally, simultaneous evaluation of signaling proteins at the single cell level (multiphosphorylated cells) revealed that interaction with gram positive and negative bacteria resulted in complex and diverse signaling patterns. Phosphoflow holds great potential to accelerate vaccine development by identifying signaling profiles in good/poor responders.

Keywords: IgM memory B cells; Salmonella Typhi; Streptococcus pneumoniae; cell signaling; fluorescent-cell barcoding; naïve B cells; phosphoflow; vaccines.


Figures

Figure 1
Figure 1
Naïve and BM cell subpopulations defined by IgD and CD27 markers in PBMC. Four B cell (CD19+ CD3−) subpopulations are defined by expression of IgD and CD27: Naïve (IgD+ CD27−), Um (IgD+ CD27+), Sm CD27+ (IgD− CD27+), and Sm CD27− (IgD− CD27−) (A). The percentages of these B-cell subpopulations showed little variation in 8 healthy adult volunteers (B). An example of surface Ig isotype (IgM, IgD, IgA, and IgG) distribution in B cell subpopulations in a representative volunteer is shown (C). Dotted lines indicate where the gates were set to determine the percentage of each Ig class. (D) Compiled data of the percentages of the Ig isotypes on the surface of each B-cell subpopulation (n = 8).
Figure 2
Figure 2
Naïve and Um B cells show different frequency of IgM molecules on the cell surface. Um B cells (black line histogram) show a higher IgM mean fluorescence intensity (MFI) on their surface than naïve B cells (gray closed histogram) as shown in this representative volunteer (A). Compiled data from 8 healthy adults (B). ***p = 0.0001.
Figure 3
Figure 3
Anti-IgM induces specific Syk(Y352) phosphorylation in naïve and Um B cells. Only Um and Naïve B cells, which co-express IgM and IgD, showed robust Syk phosphorylation after PBMC stimulation with anti-IgM (A). Interestingly, a small peak was detected in Sm CD27+ cells, which probably corresponds to IgM cells present in Sm CD27+ cells (Figure 1D). No phosphorylation of Syk was detected in Sm CD27− B cells (A). PBMC were also stimulated with anti-IgA and -IgG (B and C, respectively). Syk phosphorylation was detected in Sm CD27+ and Sm CD27−, but not in naïve and Um B cells (B and C).
Figure 4
Figure 4
Fluorescent-cell barcoding (FCB) and time course of Syk phosphorylation in naïve and Um B cells. FCB was introduced in the pacific orange channel (0, 0.4, and 2 μg/ml) to enable assay multiplexing of 3 samples at a time (see details in “Materials and Methods”) and collected samples were deconvoluted for analysis (A). Time course experiments of PBMC stimulated with anti-IgM showed that both, Um and naïve cells phosphorylated Syk after BCR stimulation (B); however, Um cells showed stronger phosphorylation than naïve cells (C). Higher levels of total Syk molecules are present in Um (black line histogram) than in naïve (gray histogram) B cells (D). Data is shown for one representative volunteer.
Figure 5
Figure 5
Time course of signaling proteins and pathways associated with the BCR in naïve and Um B cells. Two multicolor panels were used to explore simultaneous phosphorylation of signaling proteins and pathways associated with the BCR at various time points. The data shown is from one representative volunteer and is presented as mean fluorescence intensity (MFI). Um demonstrated enhanced phosphorylation potential for all the phosphoproteins assayed compared to naïve B cells (A to E) following anti-IgM stimulation. Interestingly, Um and naïve B cells demonstrated phosphorylation of Syk, Btk, and Akt (A,B, and C), which suggest that the PI3K pathway is activated in both cell populations. However, p38MAPK and pERK1/2 (D and E) are phosphorylated only in the Um subset, suggesting that the PLC-γ2 pathway is also activated in these cells. Additionally, different phosphoproteins have different kinetics. For example, the peak of Syk phosphorylation was detected at 5 min after stimulation (A), and then slowly declined; meanwhile, Akt, p38MAPK, and Erk1/2 showed a biphasic behavior (C,D, and E), which is also evident, but less prominent in Btk (B).
Figure 6
Figure 6
Phosphatases in Um B cells are more susceptible to inhibition by H2O2. PBMC were treated with 6 mM of H2O2 and phosphorylation of proteins associated with the BCR were measured in naïve and Um B cells (A and B) after 5 min of stimulation at 37°C. Displayed are overlaps of unstimulated (1% BSA) (red) and stimulated (H2O2 without anti-IgM) (purple) naïve B cells (A). Similar data display was used for Um B cells (B). Shown are percentages (red letter/numbers = negative controls; purple letter/numbers = H2O2 stimulation) as well as fold changes in mean fluorescence intensity (MFI) of stimulated compared to unstimulated cells. Um cells showed enhanced phosphorylation of Syk and p38MAPK (B), compared to naïve B cells (A). Akt phosphorylation was similar in both cell populations (A and B).
Figure 7
Figure 7
Time course of phosphorylation of BCR-associated signaling proteins in Sm CD27+ and Sm CD27− B cells following anti-IgA and anti-IgG stimulation. Anti-IgA and anti-IgG stimulated PBMC were assayed for phosphorylation of Syk, Btk, and Akt (A and B, respectively) at different time points (1, 2, 5, 8, 10, 15, 20, and 30 min).
Figure 8
Figure 8
Phosphatases in Sm CD27+ and Sm CD27− B cells are similarly susceptible to inhibition by H2O2. PBMC were treated with 6 mM of H2O2 phosphorylation of proteins associated with the BCR were detected in both, naïve and Um B cells (A and B) after 5 min stimulation at 37°C. Displayed are overlaps of unstimulated (1% BSA) (red) and 6 mM of H2O2 stimulated (without anti-IgM) (purple) naïve and Um B-cells. Percentage as well as fold changes in MFI (as compared to unstimulated) are shown. Um cells showed enhanced phosphorylation of Syk and p38MAPK (B), compared to naïve B cells (A). Akt phosphorylation was similar in both cell populations (A and B).
Figure 9
Figure 9
Fluorescently labeled bacteria bind preferentially to naïve and Um B cells. Heat-killed S. Typhi (gram negative) and S. pneumoniae (encapsulated gram positive) bacteria were fluorescently labeled with Alexa700 (A). Unstained bacteria (red closed histograms) and stained bacteria (continuous lines) are shown in panel A. PBMC were incubated with labeled bacteria at a MOI of 100:1 for 10 min at 37°C and the population of B cells recognizing the bacteria identified (B). A higher percentage of B cells recognizing S. pneumoniae than S. Typhi (B) was observed. A higher proportion of naïve than Um B-cell subpopulations was found to interact with the bacteria (C). B and C show data observed in a representative volunteer.
Figure 10
Figure 10
Bacteria-induced cell signaling in Um B cells. B cells interacting with fluorescently labeled bacteria were assayed for phosphorylation of signaling proteins (Syk, Akt, and p38MAPK). Shown are phosphorylation patterns in Um B cells from a representative volunteer following stimulation with S. Typhi (A) or S. pneumoniae (B) at the 10 min time point.
Figure 11
Figure 11
Multiphosphorylated Um B cells. Whether single or multiple proteins were phosphorylated simultaneously (A) was evaluated by gating on Um cells which bound S. Typhi or S. pneumoniae (B and C, respectively). Multiple tri-dimensional views (rotated on the X axis) from a representative volunteer are displayed (stimulation with S. pneumoniae for 10 min) (A). Spheres represent individual cells and the colors of the spheres are the result of combination of primary colors at the origin of each axis [x axis: red (pSyk); y axis: blue (pAkt); and z axis: green (pp38MAPK)] (A). Percentage of Um B cells that showed, one, two, or three proteins phosphorylated simultaneously following stimulation with S. Typhi or S. pneumoniae (B and C, respectively).
Figure A1
Figure A1
Evaluation of antibodies for phosphoflow in naïve and BM cell subpopulations. Example of surface staining for identification of B cells and their subpopulations. CD19 and CD20 are typically used to define B cell populations (A). Several monoclonal antibodies were evaluated to define B cells, as well as naïve and memory B cell subpopulations during the optimization of the staining technique for phosphoflow. The CD19 marker is lost when cells are treated for phosphoprotein determinations; however, CD20 (H1 clone) defines these cells appropriately and therefore was subsequently used in phosphoflow assays (B). Polyclonal anti-IgD sera (goat anti-human) used in a two step staining technique (see “Materials and Methods” for details) provided appropriate resolution of naïve and memory B cell subpopulations for phosphoflow staining (B). FSC, forward scatter.
Figure A2
Figure A2
Time course of phosphorylation of pSyk in Sm CD27+ and Sm CD27− B cells following anti-IgA and anti-IgG stimulation. PBMC from healthy volunteers were stimulated with either anti-IgA or anti-IgG and phosphorylation of Syk was evaluated at different time points (1, 2, 5, 8, 10, 15, 20, and 30 min) in Sm CD27+ and Sm CD27− B cell populations (A). Samples were fluorescently barcoded for multiplexing. Displayed are detailed histograms of pSyk following anti-IgA (B) and -IgG (C) at each time point.

Similar articles

Cited by

References

    1. Baba Y., Hashimoto S., Matsushita M., Watanabe D., Kishimoto T., Kurosaki T., et al. (2001). BLNK mediates Syk-dependent Btk activation. Proc. Natl. Acad. Sci. U.S.A. 98, 2582–2586 10.1073/pnas.051626198 - DOI - PMC - PubMed
    1. Benschop R. J., Cambier J. C. (1999). B cell development: signal transduction by antigen receptors and their surrogates. Curr. Opin. Immunol. 11, 143–151 10.1016/S0952-7915(99)80025-9 - DOI - PubMed
    1. Biragyn A., Lee Chang C. (2012). A new paradigm for an old story: the role of regulatory B cells in cancer. Front. Immunol. 3:206 10.3389/fimmu.2012.00206 - DOI - PMC - PubMed
    1. Blair P. A., Noreña L. Y., Flores-Borja F., Rawlings D. J., Isenberg D. A., Ehrenstein M. R., et al. (2010). CD19+CD24hiCD38hi B Cells exhibit regulatory capacity in healthy individuals but are functionally impaired in systemic lupus erythematosus patients. Immunity 32, 129–140 10.1016/j.immuni.2009.11.009 - DOI - PubMed
    1. Chen L., Monti S., Juszczynski P., Daley J., Chen W., Witzig T. E., et al. (2008). SYK-dependent tonic B-cell receptor signaling is a rational treatment target in diffuse large B-cell lymphoma. Blood 111, 2230–2237 10.1182/blood-2007-07-100115 - DOI - PMC - PubMed

Publication types

Substances