

SIMPATIQCO: a server-based software suite which facilitates monitoring the time course of LC-MS performance metrics on Orbitrap instruments
- PMID: 23088386
- PMCID: PMC3558011
- DOI: 10.1021/pr300163u
SIMPATIQCO: a server-based software suite which facilitates monitoring the time course of LC-MS performance metrics on Orbitrap instruments
Abstract
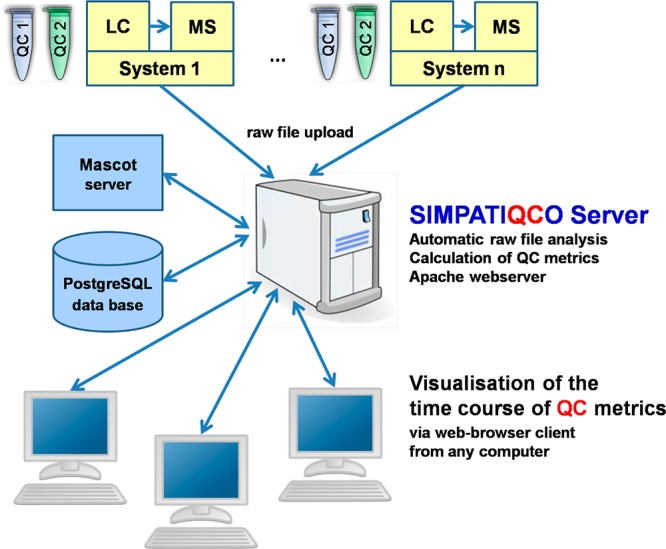
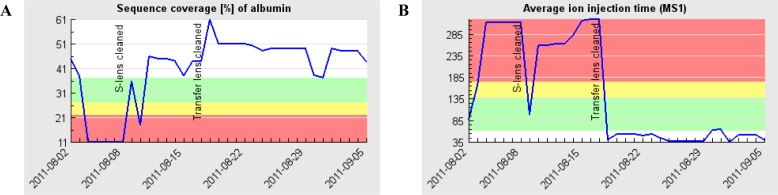
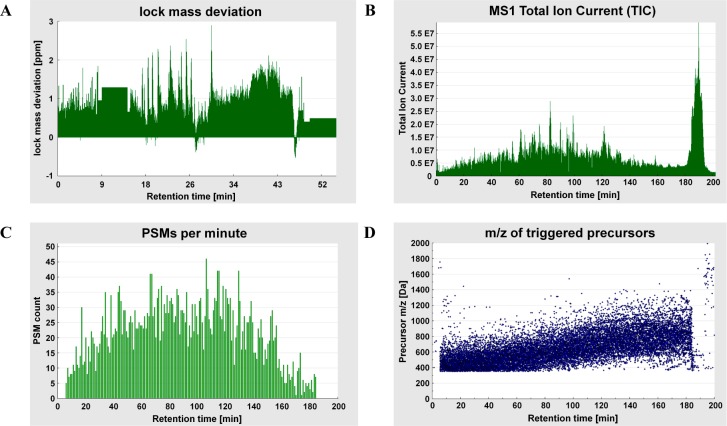
While the performance of liquid chromatography (LC) and mass spectrometry (MS) instrumentation continues to increase, applications such as analyses of complete or near-complete proteomes and quantitative studies require constant and optimal system performance. For this reason, research laboratories and core facilities alike are recommended to implement quality control (QC) measures as part of their routine workflows. Many laboratories perform sporadic quality control checks. However, successive and systematic longitudinal monitoring of system performance would be facilitated by dedicated automatic or semiautomatic software solutions that aid an effortless analysis and display of QC metrics over time. We present the software package SIMPATIQCO (SIMPle AuTomatIc Quality COntrol) designed for evaluation of data from LTQ Orbitrap, Q-Exactive, LTQ FT, and LTQ instruments. A centralized SIMPATIQCO server can process QC data from multiple instruments. The software calculates QC metrics supervising every step of data acquisition from LC and electrospray to MS. For each QC metric the software learns the range indicating adequate system performance from the uploaded data using robust statistics. Results are stored in a database and can be displayed in a comfortable manner from any computer in the laboratory via a web browser. QC data can be monitored for individual LC runs as well as plotted over time. SIMPATIQCO thus assists the longitudinal monitoring of important QC metrics such as peptide elution times, peak widths, intensities, total ion current (TIC) as well as sensitivity, and overall LC-MS system performance; in this way the software also helps identify potential problems. The SIMPATIQCO software package is available free of charge.
Figures
References
-
- Martens L.; Vizcaino J. A.; Banks R. Quality control in proteomics. Proteomics 2011, 1161015–6. - PubMed
-
- Kinsinger C. R.; Apffel J.; Baker M.; Bian X.; Borchers C. H.; Bradshaw R.; Brusniak M. Y.; Chan D. W.; Deutsch E. W.; Domon B.; Gorman J.; Grimm R.; Hancock W.; Hermjakob H.; Horn D.; Hunter C.; Kolar P.; Kraus H. J.; Langen H.; Linding R.; Moritz R. L.; Omenn G. S.; Orlando R.; Pandey A.; Ping P.; Rahbar A.; Rivers R.; Seymour S. L.; Simpson R. J.; Slotta D.; Smith R. D.; Stein S. E.; Tabb D. L.; Tagle D.; Yates J. R.; Rodriguez H. Recommendations for mass spectrometry data quality metrics for open access data (corollary to the Amsterdam Principles). J. Proteome Res. 2012, 1121412–9. - PMC - PubMed
-
- Kocher T.; Pichler P.; Swart R.; Mechtler K. Quality control in LC-MS/MS. Proteomics 2011, 1161026–30. - PubMed
Publication types
MeSH terms
LinkOut - more resources
Full Text Sources
