

Clustering and classification of regional peak plantar pressures of diabetic feet
- PMID: 23089457
- PMCID: PMC4538932
- DOI: 10.1016/j.jbiomech.2012.09.007
Clustering and classification of regional peak plantar pressures of diabetic feet
Abstract
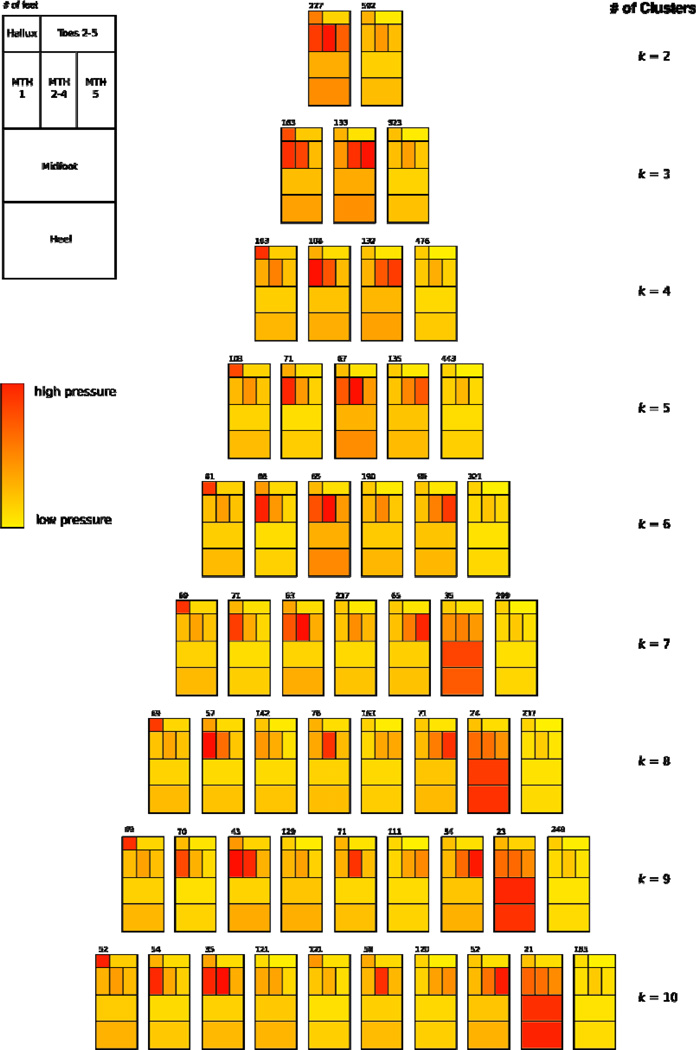
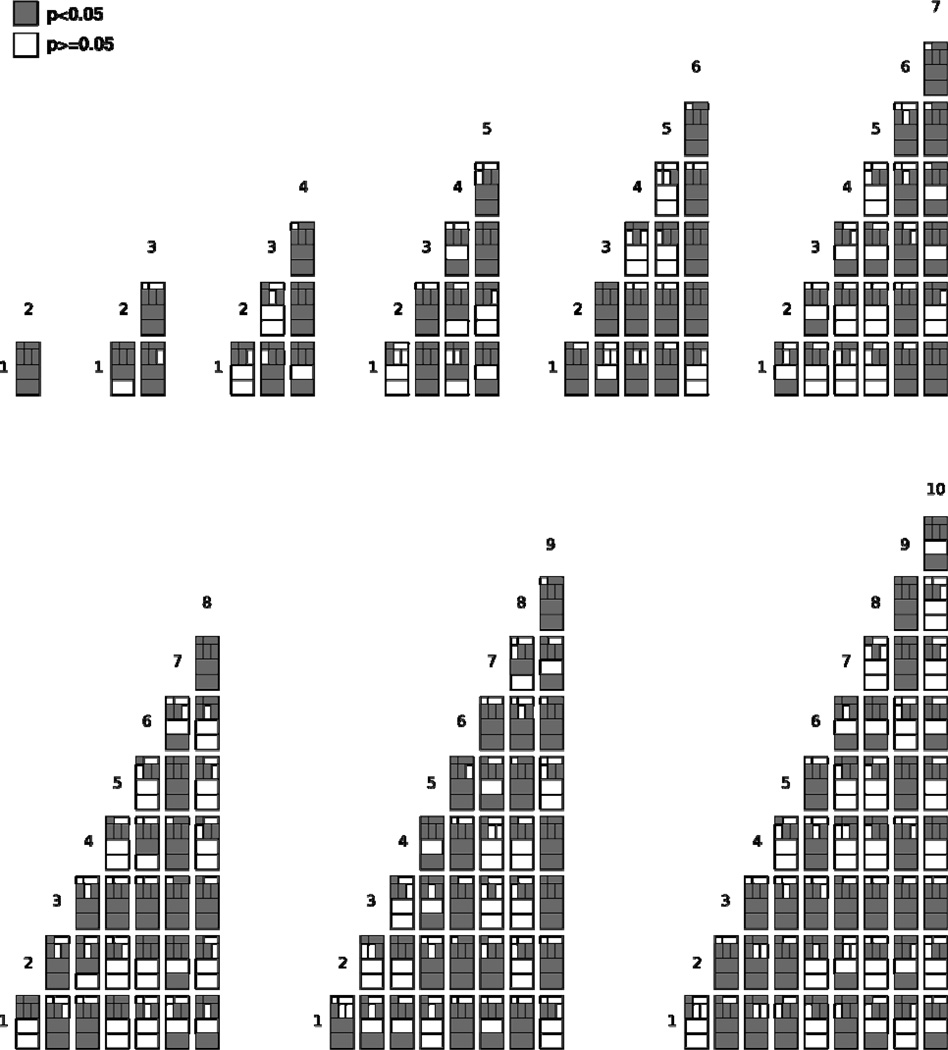
High plantar pressures have been associated with foot ulceration in people with diabetes, who can experience loss of protective sensation due to peripheral neuropathy. Therefore, characterization of elevated plantar pressure distributions can provide a means of identifying diabetic patients at potential risk of foot ulceration. Plantar pressure distribution classification can also be used to determine suitable preventive interventions, such as the provision of an appropriately designed insole. In the past, emphasis has primarily been placed on the identification of individual focal areas of elevated pressure. The goal of this study was to utilize k-means clustering analysis to identify typical regional peak plantar pressure distributions in a group of 819 diabetic feet. The number of clusters was varied from 2 to 10 to examine the effect on the differentiation and classification of regional peak plantar pressure distributions. As the number of groups increased, so too did the specificity of their pressure distributions: starting with overall low or overall high peak pressure groups and extending to clusters exhibiting several focal peak pressures in different regions of the foot. However, as the number of clusters increased, the ability to accurately classify a given regional peak plantar pressure distribution decreased. The balance between these opposing constraints can be adjusted when assessing patients with feet that are potentially "at risk" or while prescribing footwear to reduce high regional pressures. This analysis provides an understanding of the variability of the regional peak plantar pressure distributions seen within the diabetic population and serves as a guide for the preemptive assessment and prevention of diabetic foot ulcers.
Copyright © 2012 Elsevier Ltd. All rights reserved.
Conflict of interest statement
Ahmet Erdemir owns and operates innodof, LLC, a computational modeling and simulation company. Peter R. Cavanagh holds equity in DIApedia, LLC, and is a consultant for Langer, UK.
Figures


References
-
- Abbott CA, Garrow AP, Carrington AL, Morris J, Van Ross ER, Boulton AJ. Foot ulcer risk is lower in South-Asian and african-Caribbean compared with European diabetic patients in the U.K.: the North-West diabetes foot care study. Diabetes Care. 2005;28(8):1869–1875. - PubMed
-
- Acharya R, Tan PH, Subramaniam T, Tamura T, Chua KC, Goh SC, Lim CM, Goh SY, Chung KR, Law C. Automated identification of diabetic type 2 subjects with and without neuropathy using wavelet transform on pedobarograph. Journal of Medical Systems. 2008;32(1):21–29. - PubMed
-
- Acharya UR, Tong J, Subbhuraam VS, Chua CK, Ha TP, Ghista DN, Chattopadhyay S, Ng KH, Suri JS. Computer-Based Identification of Type 2 Diabetic Subjects with and Without Neuropathy Using Dynamic Planter Pressure and Principal Component Analysis. Journal of Medical Systems. 2011;36(4):2483–2491. - PubMed
-
- Bennett PJ, Duplock LR. Pressure distribution beneath the human foot. Journal of the American Podiatric Medical Association. 1993;83(12):674–678. - PubMed
-
- Bus SA, Arts MLJ, Waaijman R, de Haart M, Busch-Westbroek T, van Baal SG, Nollet F. The effectiveness of using in-shoe plantar pressure assessment and monitoring in prescription therapeutic footwear to prevent plantar foot ulcer recurrence in diabetic patients: a multicenter randomized controlled trial. Journal of Foot and Ankle Research. 2012;5(1 Suppl):O11.
Publication types
MeSH terms
Grants and funding
LinkOut - more resources
Full Text Sources
Other Literature Sources
Medical
Research Materials
Miscellaneous
