

Fully moderated T-statistic for small sample size gene expression arrays
- PMID: 23089813
- PMCID: PMC3192003
- DOI: 10.2202/1544-6115.1701
Fully moderated T-statistic for small sample size gene expression arrays
Abstract
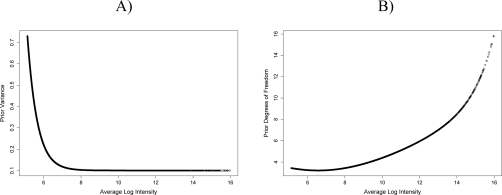
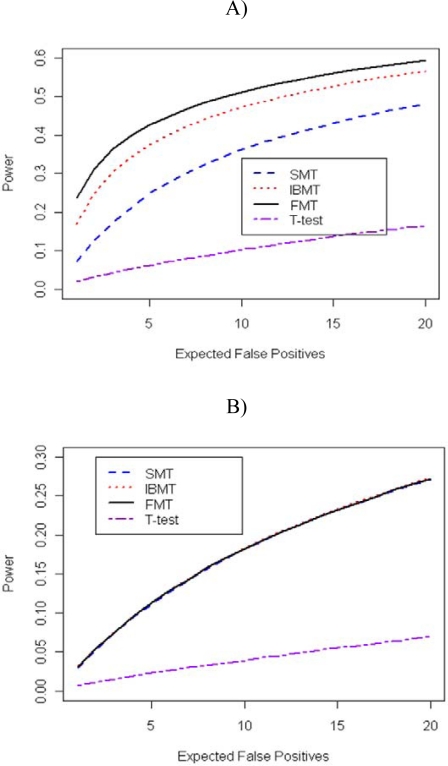
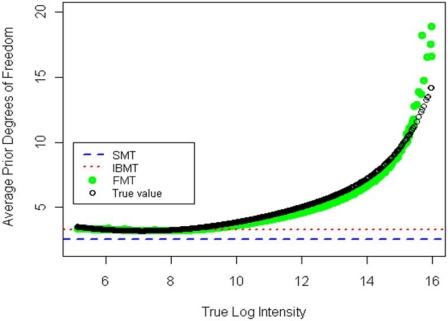
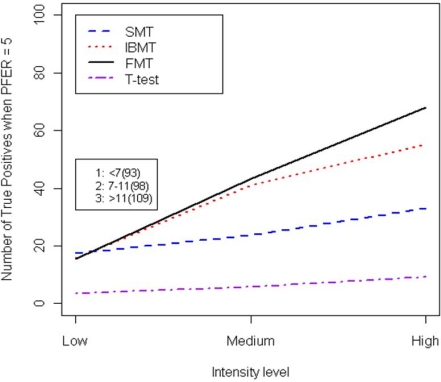
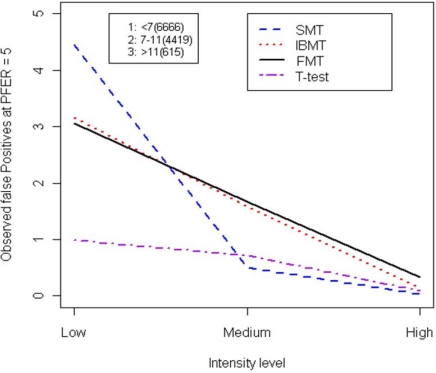
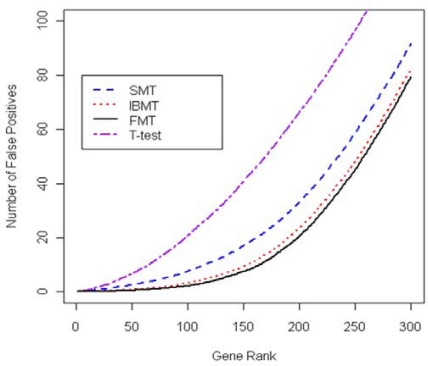
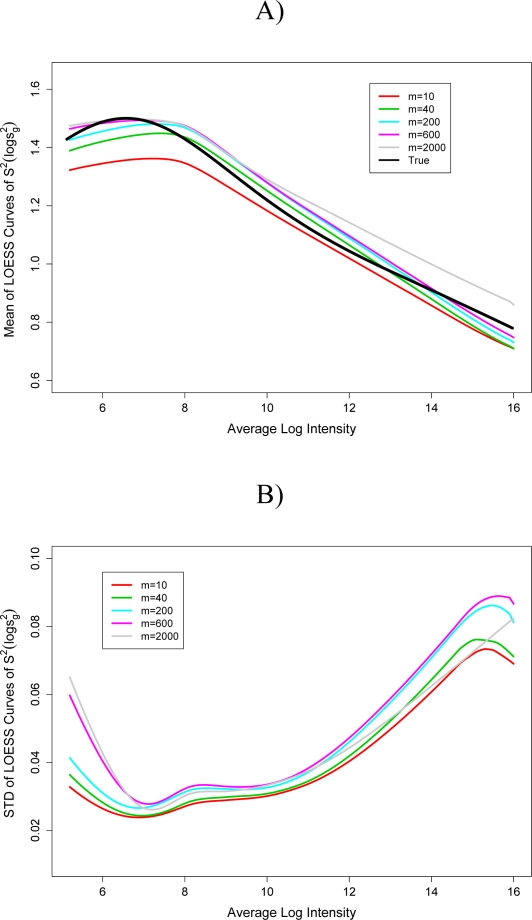
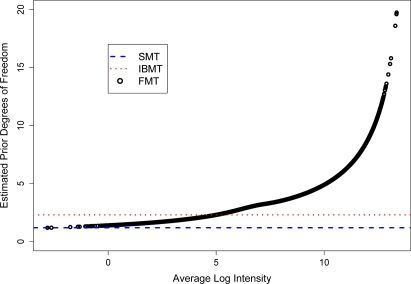
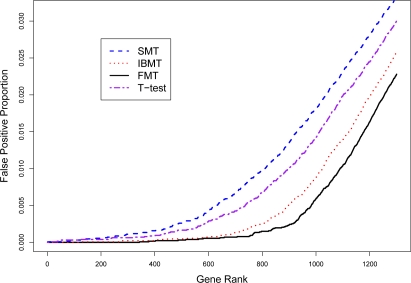
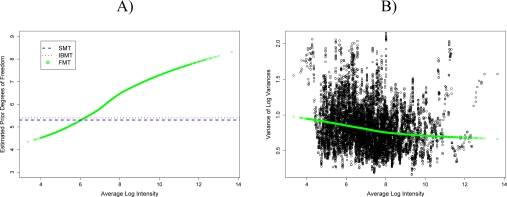
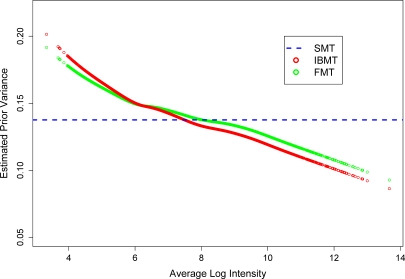
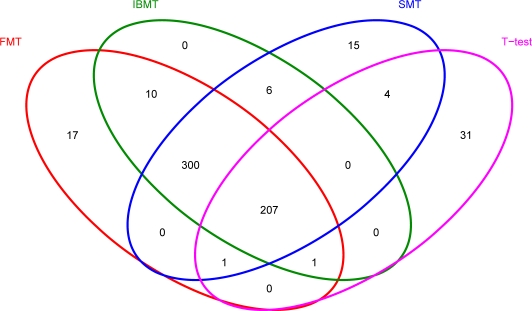
Gene expression microarray experiments with few replications lead to great variability in estimates of gene variances. Several Bayesian methods have been developed to reduce this variability and to increase power. Thus far, moderated t methods assumed a constant coefficient of variation (CV) for the gene variances. We provide evidence against this assumption, and extend the method by allowing the CV to vary with gene expression. Our CV varying method, which we refer to as the fully moderated t-statistic, was compared to three other methods (ordinary t, and two moderated t predecessors). A simulation study and a familiar spike-in data set were used to assess the performance of the testing methods. The results showed that our CV varying method had higher power than the other three methods, identified a greater number of true positives in spike-in data, fit simulated data under varying assumptions very well, and in a real data set better identified higher expressing genes that were consistent with functional pathways associated with the experiments.
Figures
Similar articles
-
Intensity-based hierarchical Bayes method improves testing for differentially expressed genes in microarray experiments.BMC Bioinformatics. 2006 Dec 19;7:538. doi: 10.1186/1471-2105-7-538. BMC Bioinformatics. 2006. PMID: 17177995 Free PMC article.
-
Empirical Bayes models for multiple probe type microarrays at the probe level.BMC Bioinformatics. 2008 Mar 20;9:156. doi: 10.1186/1471-2105-9-156. BMC Bioinformatics. 2008. PMID: 18366694 Free PMC article.
-
Sensitivity and specificity of inferring genetic regulatory interactions from microarray experiments with dynamic Bayesian networks.Bioinformatics. 2003 Nov 22;19(17):2271-82. doi: 10.1093/bioinformatics/btg313. Bioinformatics. 2003. PMID: 14630656
-
A random variance model for detection of differential gene expression in small microarray experiments.Bioinformatics. 2003 Dec 12;19(18):2448-55. doi: 10.1093/bioinformatics/btg345. Bioinformatics. 2003. PMID: 14668230
-
Construction of null statistics in permutation-based multiple testing for multi-factorial microarray experiments.Bioinformatics. 2006 Jun 15;22(12):1486-94. doi: 10.1093/bioinformatics/btl109. Epub 2006 Mar 30. Bioinformatics. 2006. PMID: 16574697
Cited by
-
Metabolic gene NR4A1 as a potential therapeutic target for non-smoking female non-small cell lung cancer patients.Thorac Cancer. 2019 Apr;10(4):715-727. doi: 10.1111/1759-7714.12989. Epub 2019 Feb 25. Thorac Cancer. 2019. PMID: 30806032 Free PMC article.
-
Disruption of stromal hedgehog signaling initiates RNF5-mediated proteasomal degradation of PTEN and accelerates pancreatic tumor growth.Life Sci Alliance. 2018 Oct 26;1(5):e201800190. doi: 10.26508/lsa.201800190. eCollection 2018 Oct. Life Sci Alliance. 2018. PMID: 30456390 Free PMC article.
-
Eps15 Homology Domain-containing Protein 3 Regulates Cardiac T-type Ca2+ Channel Targeting and Function in the Atria.J Biol Chem. 2015 May 8;290(19):12210-21. doi: 10.1074/jbc.M115.646893. Epub 2015 Mar 30. J Biol Chem. 2015. PMID: 25825486 Free PMC article.
-
Robust differential expression analysis by learning discriminant boundary in multi-dimensional space of statistical attributes.BMC Bioinformatics. 2016 Dec 19;17(1):541. doi: 10.1186/s12859-016-1386-x. BMC Bioinformatics. 2016. PMID: 27993137 Free PMC article.
-
The role of extracellular matrix in mouse and human corneal neovascularization.Sci Rep. 2019 Oct 3;9(1):14272. doi: 10.1038/s41598-019-50718-8. Sci Rep. 2019. PMID: 31582785 Free PMC article.
References
-
- Benjamini Y, Hochberg Y. “Controlling the false discovery rate: A practical and powerful approach to multiple testing,”. J. Roy. Statist. Soc. Ser. B. 1995;57:289–300.
-
- Cleveland WS. “Robust locally weighted regression and smoothing scatterplots,”. Journal of the American Statistical Association. 1979;74:829–836. doi: 10.2307/2286407. - DOI
-
- Cleveland WS, Devlin SJ. “Locally-weighted regression: An approach to regression analysis by local fitting,”. Journal of the American Statistical Association. 1988;83:596–610. doi: 10.2307/2289282. - DOI
Publication types
MeSH terms
Grants and funding
LinkOut - more resources
Full Text Sources